


A good marketing KPI report template should do three things well:
- Focus on the right KPIs
- Show progress against goals
- Make results easy to act on
At a minimum, it should include a clear executive summary with 5–7 core key performance indicators tied to business objectives, such as conversions, revenue, cost per lead, and return on investment.
From there, the report should break performance down by funnel stage—awareness, engagement, lead generation, and revenue—so stakeholders can see how marketing efforts translate into outcomes.
The best templates also combine website, SEO, paid ads, social media, and email marketing into one centralized view, using simple charts and graphs to show trends over time, not just raw numbers.
Finally, every marketing KPI report should leave room for insights and next actions, turning marketing data into clear guidance for decision-making, not just a collection of metrics.
We break down which sections, metrics, and charts to include based on our marketing KPI report template created by marketers on Whatagraph.
1. Marketing Summary
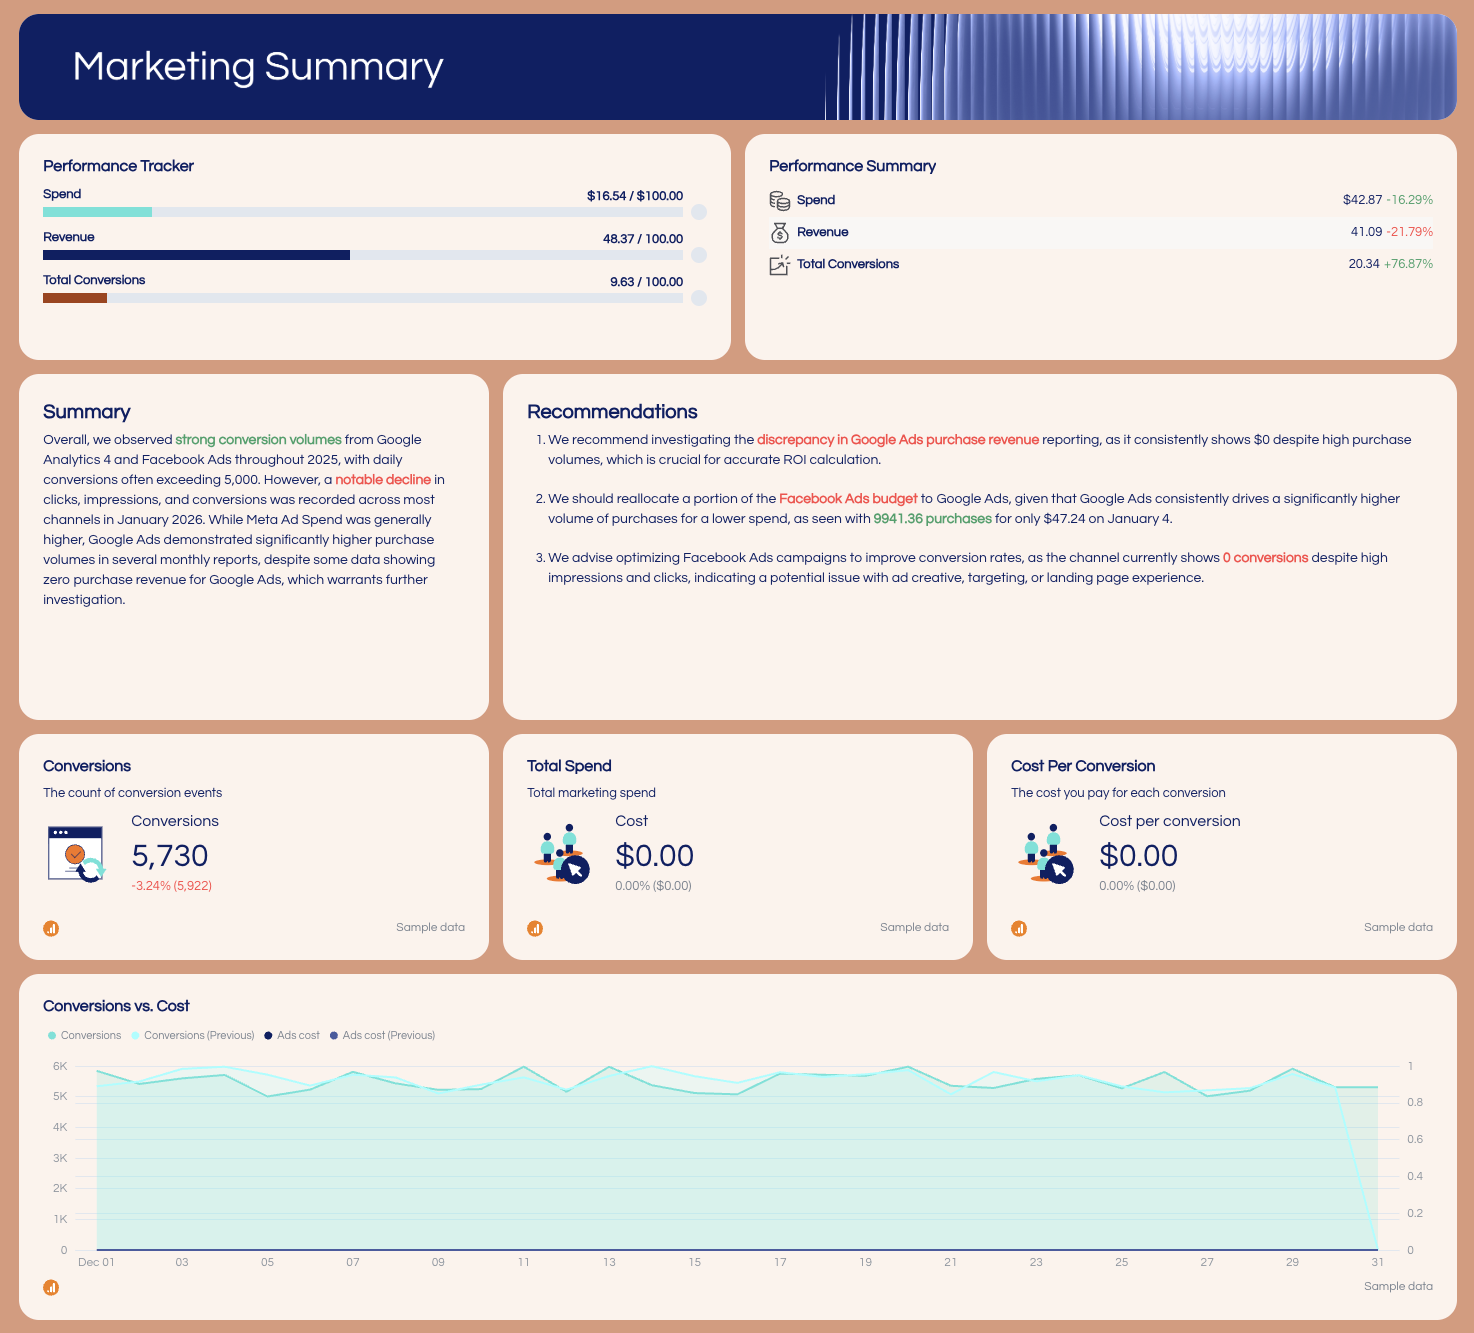
Purpose: Executive-level overview that answers “Is marketing working?” for stakeholders and supports fast decision-making.
Structure
- Written marketing summary with insights and next actions
- High-level marketing KPI tiles
- Cross-channel performance dashboard view
- Spend vs outcome comparisons tied to business objectives
Key metrics
- Total conversions (key performance indicators)
- Total marketing spend
- Revenue / purchase revenue
- Cost per conversion
- Clicks, impressions, and campaign performance by channel
- Organic social followers
- ROAS / return on ad spend
Charts & visuals
- KPI scorecards (marketing metrics with MoM change)
- Time-series line charts (conversions vs cost, real-time trends)
- Stacked bar charts by marketing channels
- Comparative bar charts (Google Ads vs Facebook Ads spend & purchases)
2. Website Performance
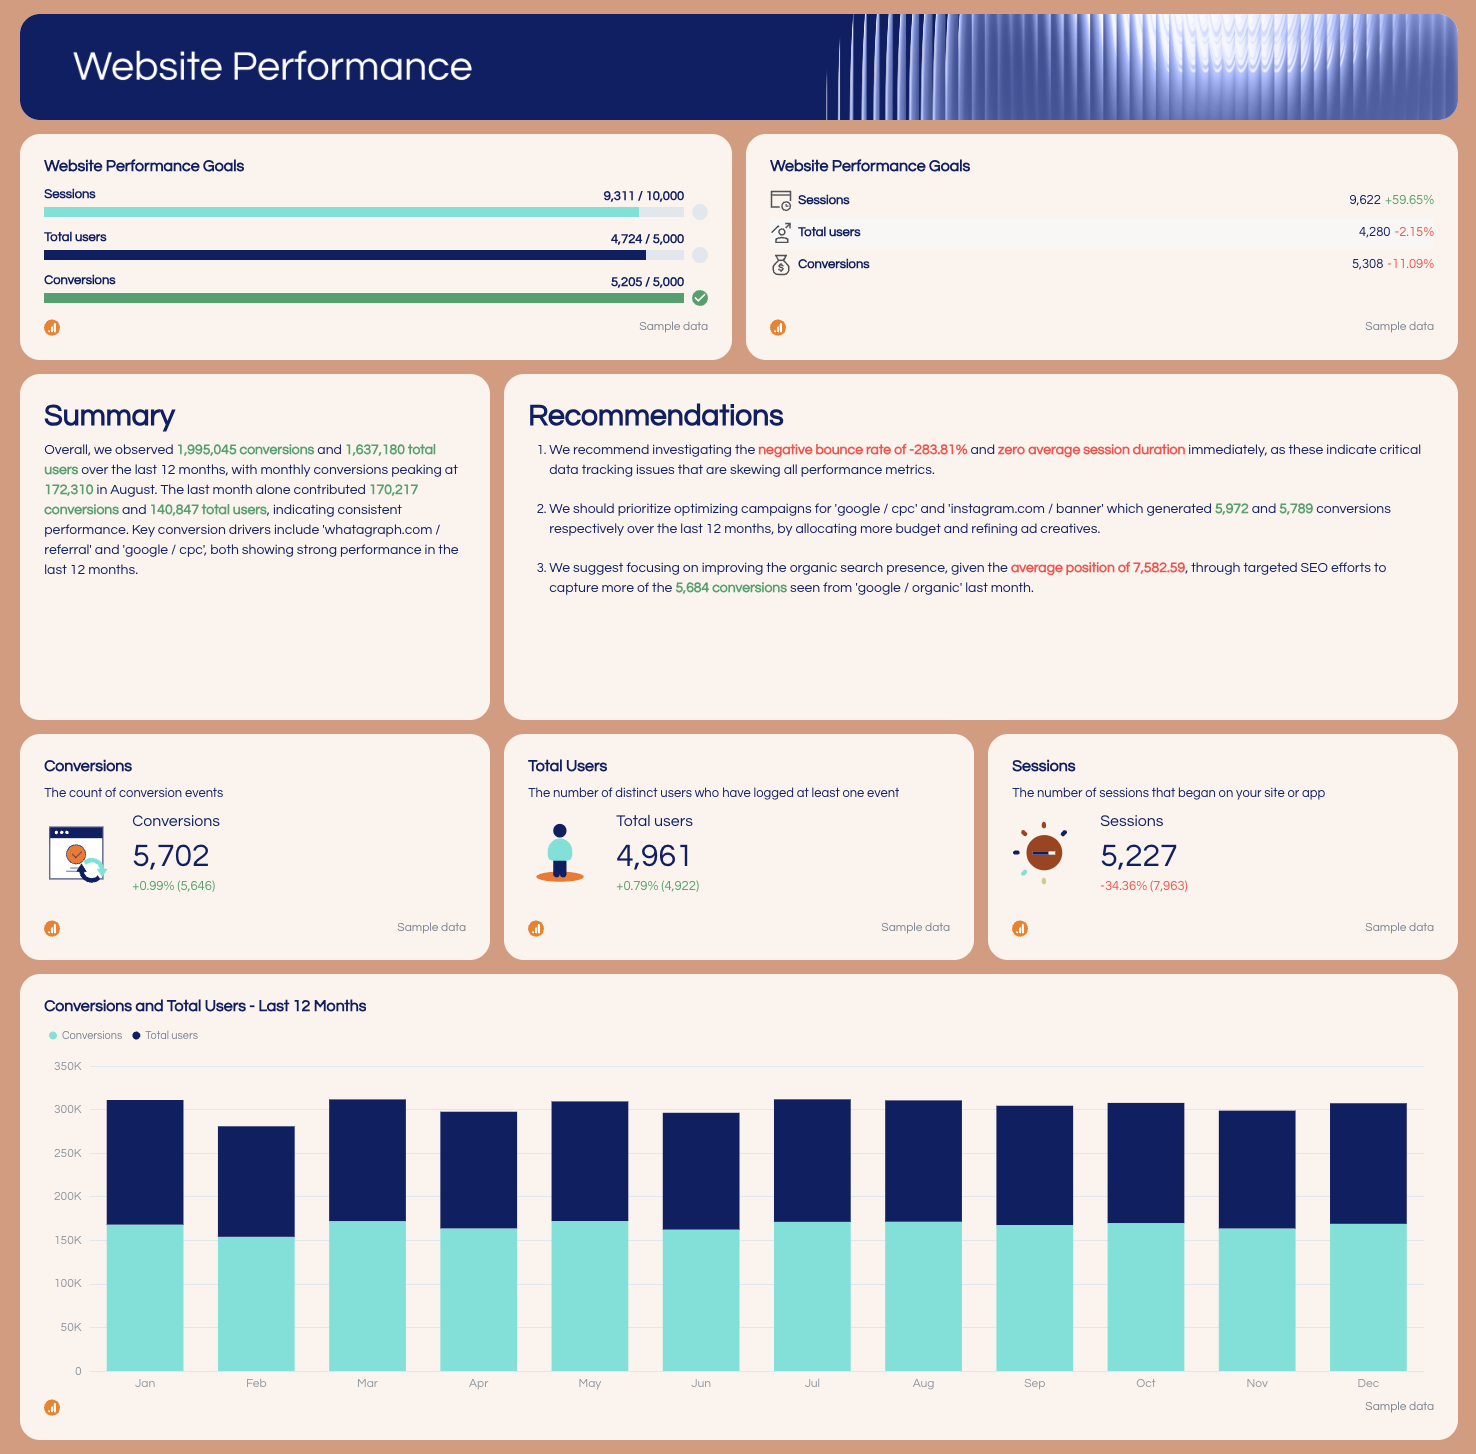
Purpose: Show how website traffic quality supports conversions and overall marketing performance.
Structure
- Summary + recommendations
- Website KPI tiles
- Traffic and conversion trends
- Source, device, and page-level breakdowns
- Goals vs actuals tracking
Key metrics
- Users & new users
- Sessions & website traffic
- Conversions & conversion rate
- Bounce rate
- Average engagement time
- Page views
- Sessions and conversions by source (organic, PPC, social media)
Charts & visuals
- Line charts (users & conversions over time)
- Bar charts (sessions by marketing channels)
- Comparison charts (new users vs conversions)
- Tables for page-level and source-level performance metrics
3. SEO Performance
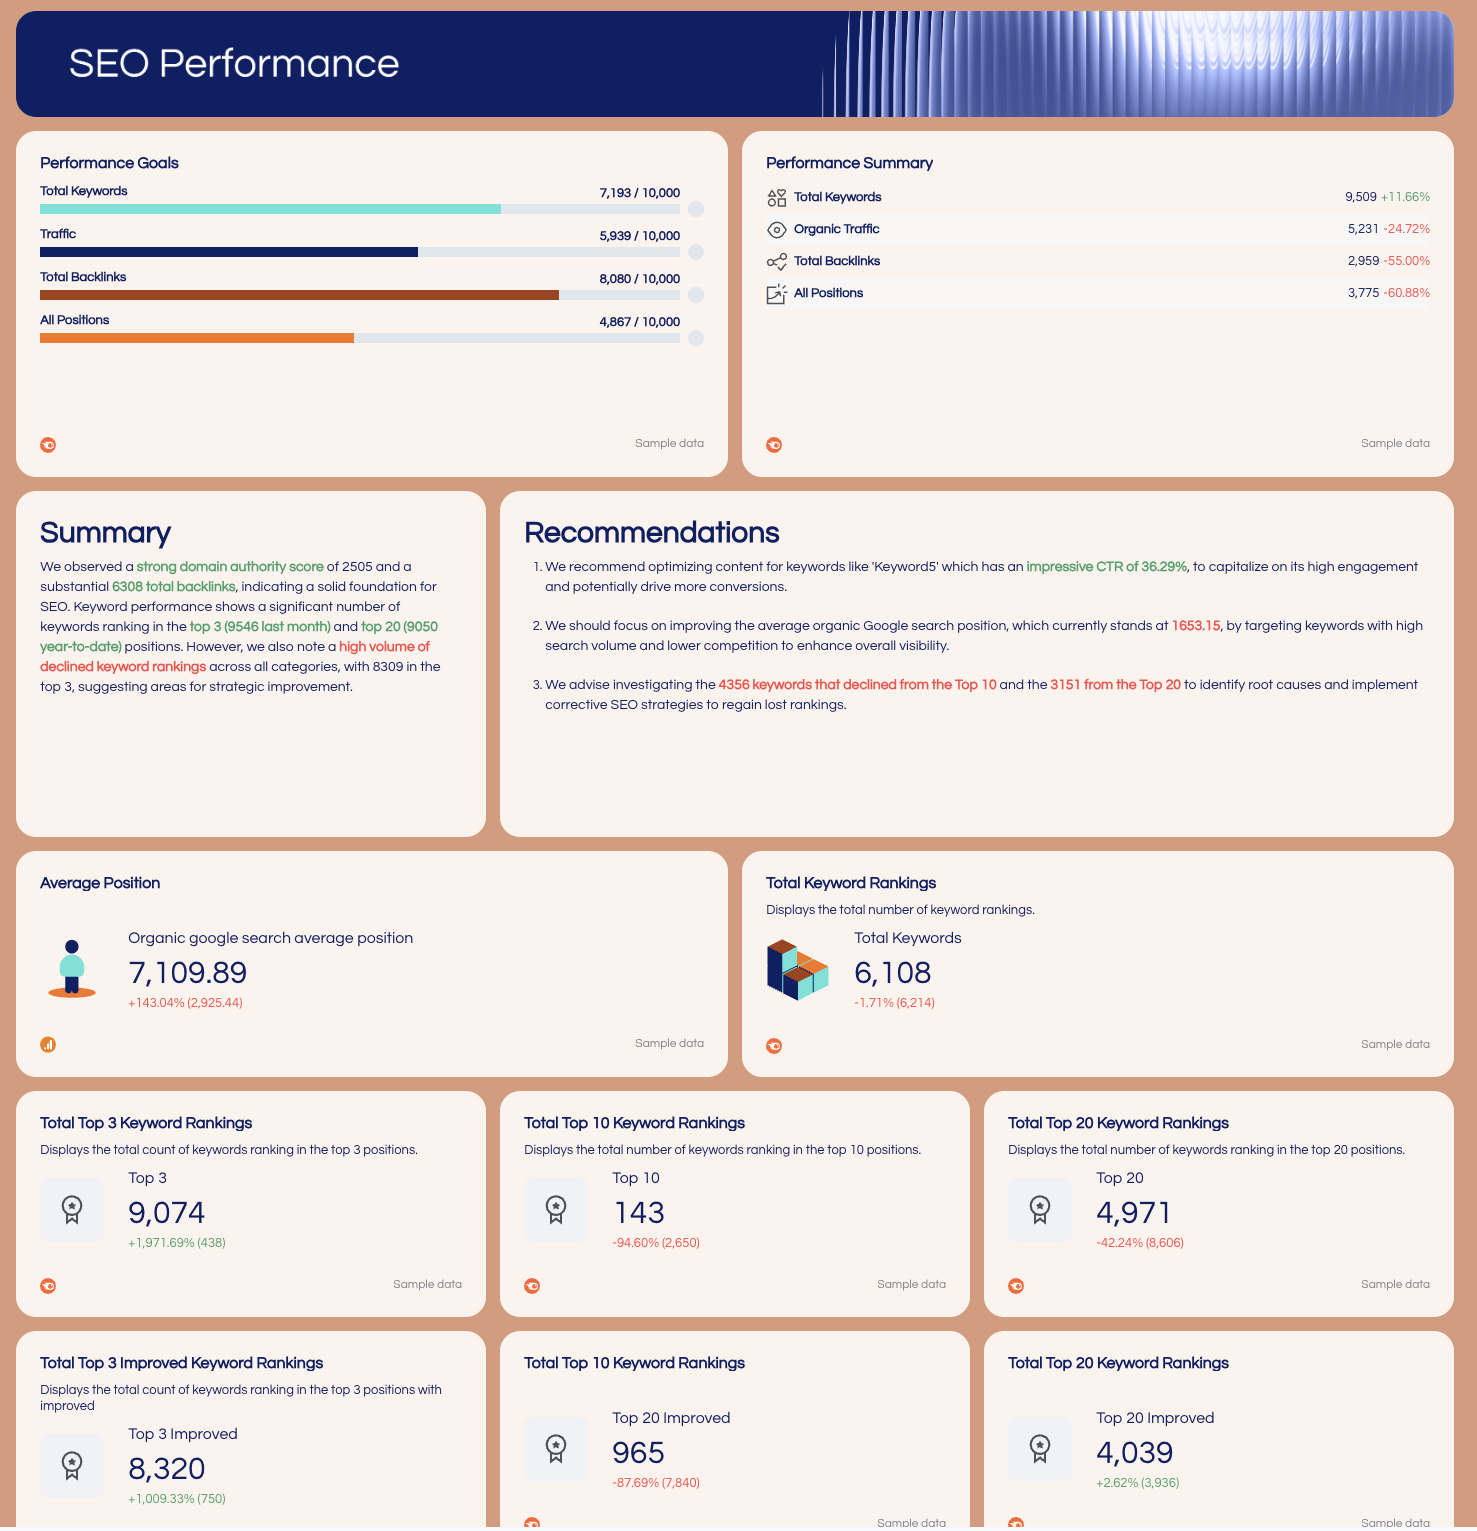
Purpose: Track organic visibility, rankings, and SEO impact on marketing results.
Structure
- SEO summary + recommendations
- Core SEO KPI tiles
- Keyword distribution and movement
- Keyword-level tables
- Backlink and authority tracking
Key metrics
- Organic traffic
- Average position & rankings
- Total keywords
- Top 3 / Top 10 / Top 20 rankings
- CTR (click-through rate)
- Backlinks and referring domains
- Domain authority
Charts & visuals
- KPI tiles for SEO report health
- Pie charts (keyword distribution)
- Time-series graphs (rankings & backlinks over time)
- Tables with keyword impressions, clicks, CPC, and performance metrics
4. Google My Business
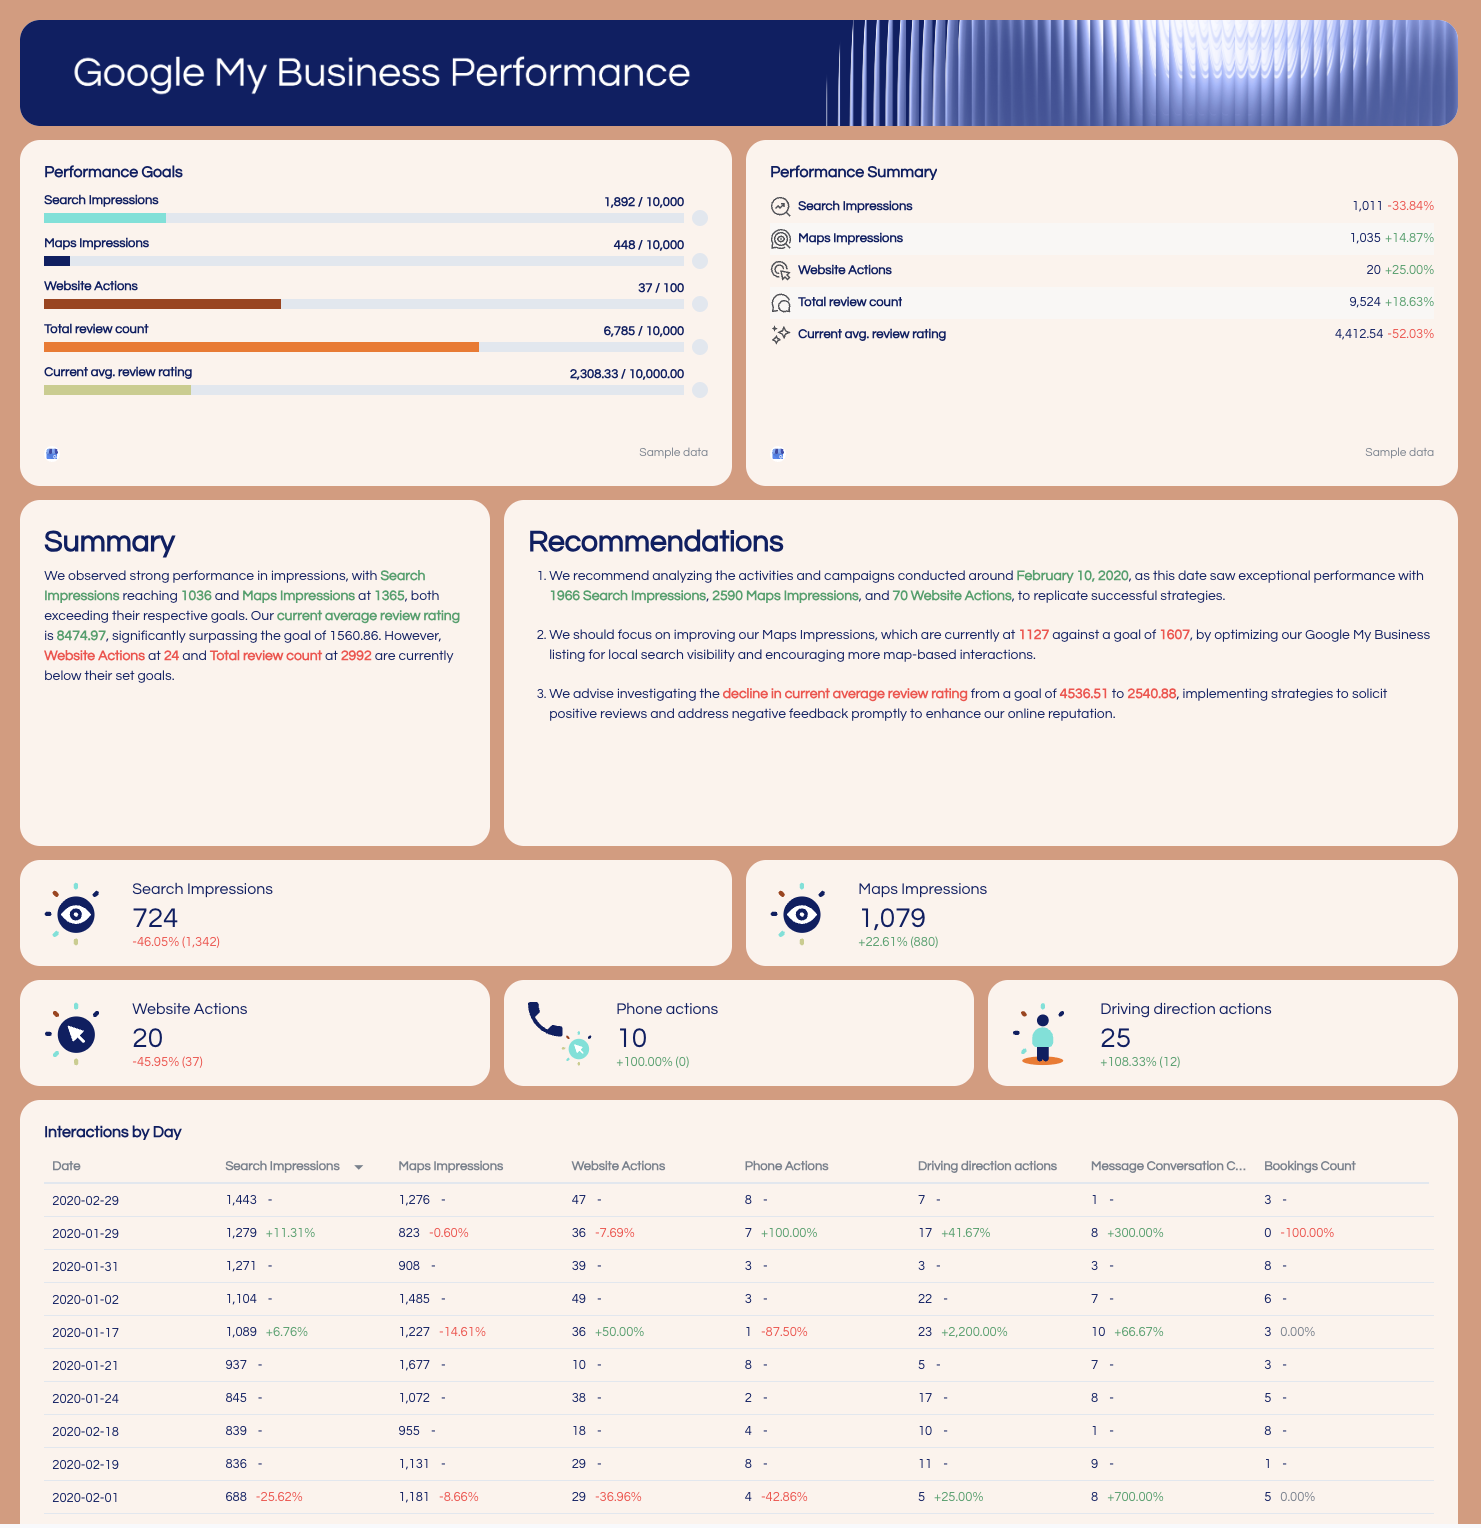
Purpose: Measure local SEO visibility and high-intent actions.
Structure
- Local performance summary
- KPI tiles
- Daily interaction breakdowns
- Device-level splits
- Review performance section
Key metrics
- Search impressions
- Maps impressions
- Website actions
- Phone calls
- Direction requests
- Review count & average rating
Charts & visuals
- KPI scorecards
- Line charts (local impressions trends)
- Daily interaction bar charts
- Tables for review performance and device usage
5. Google Ads
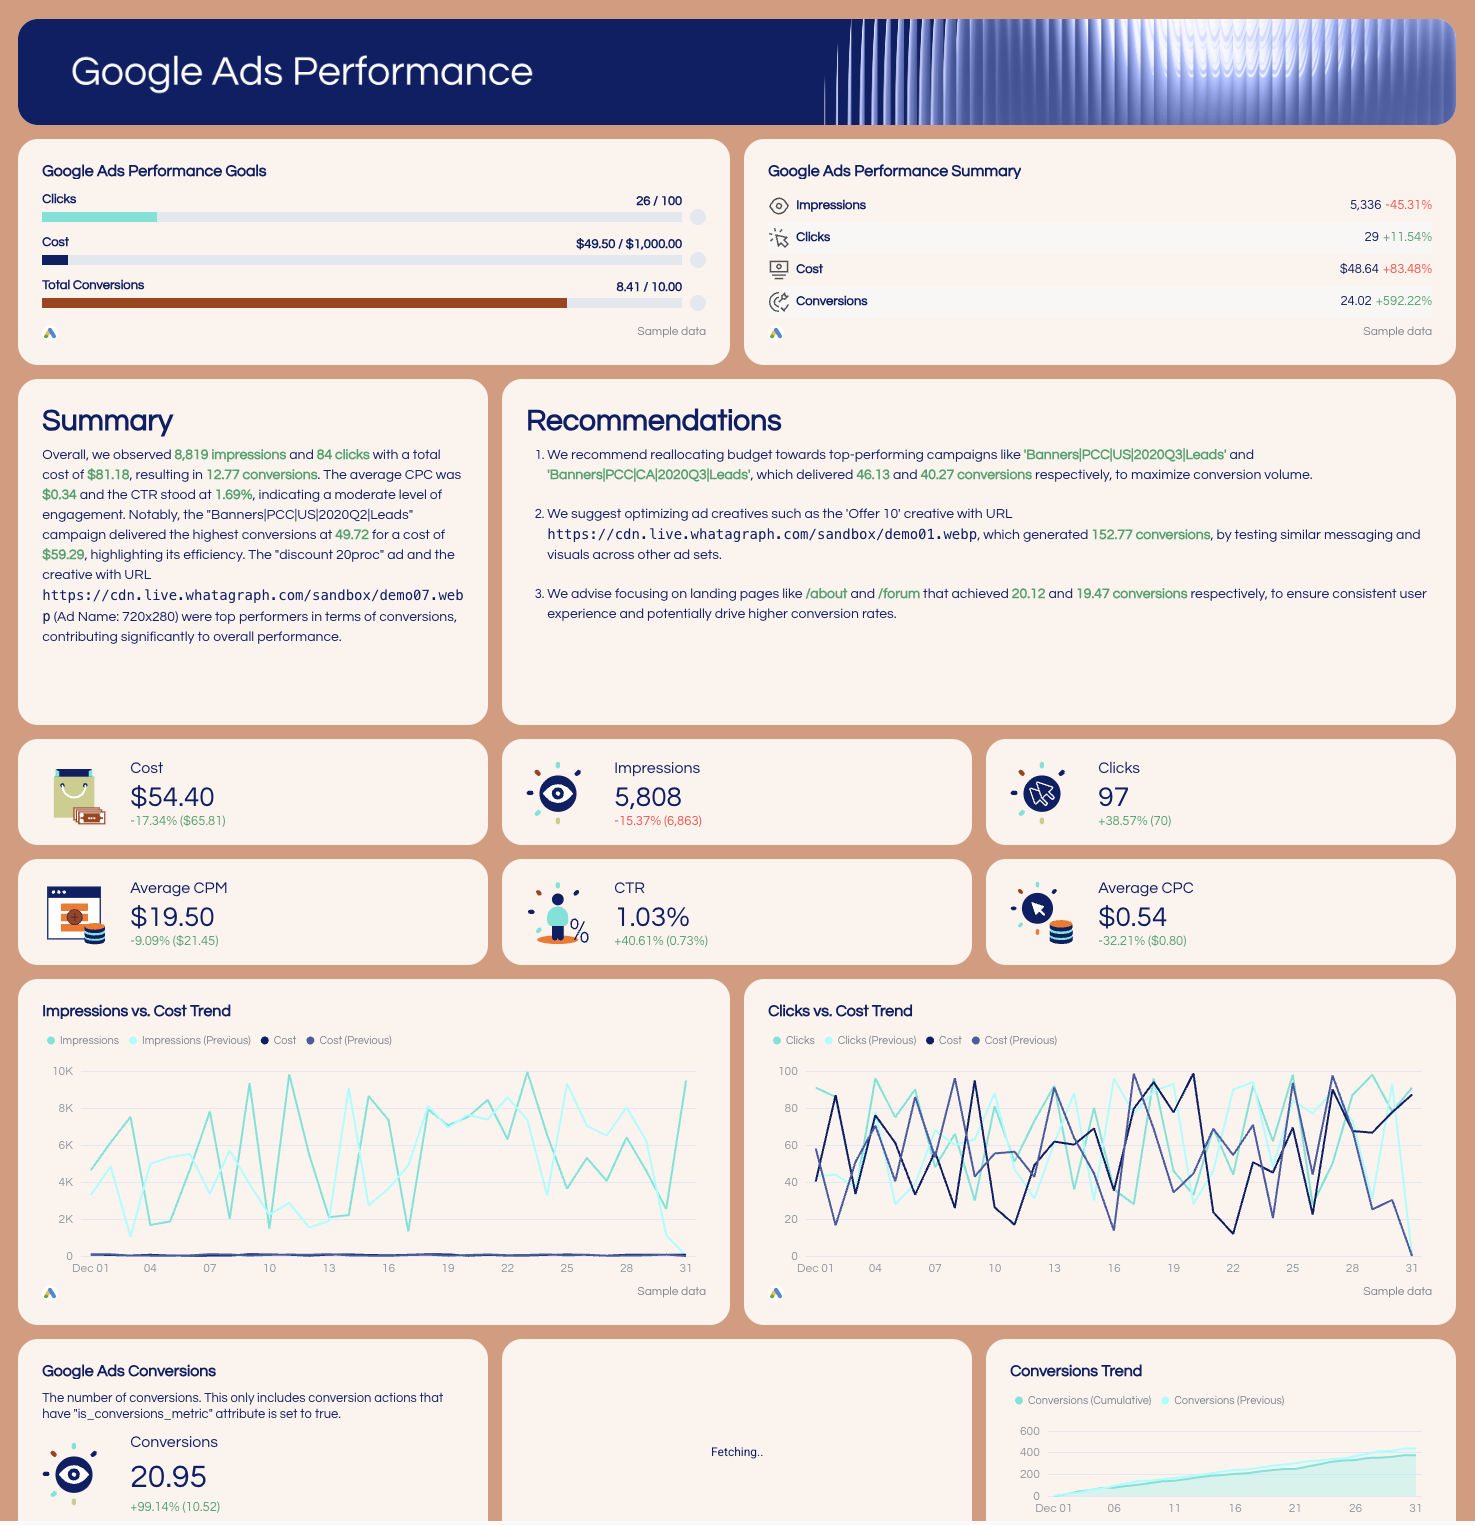
Purpose: Deep performance view for PPC and paid search optimization.
Structure
- Summary + recommendations
- Paid media KPI tiles
- Conversion funnel
- Trend analysis
- Multi-level breakdowns
Key metrics
- Spend
- Impressions
- Clicks
- CTR
- CPC & CPM
- Conversions
- Cost per lead
- ROAS
Charts & visuals
- Line charts (impressions, clicks, cost trends)
- Funnel charts (impressions → clicks → conversions)
- Tables for campaigns, ads, keywords, and landing pages
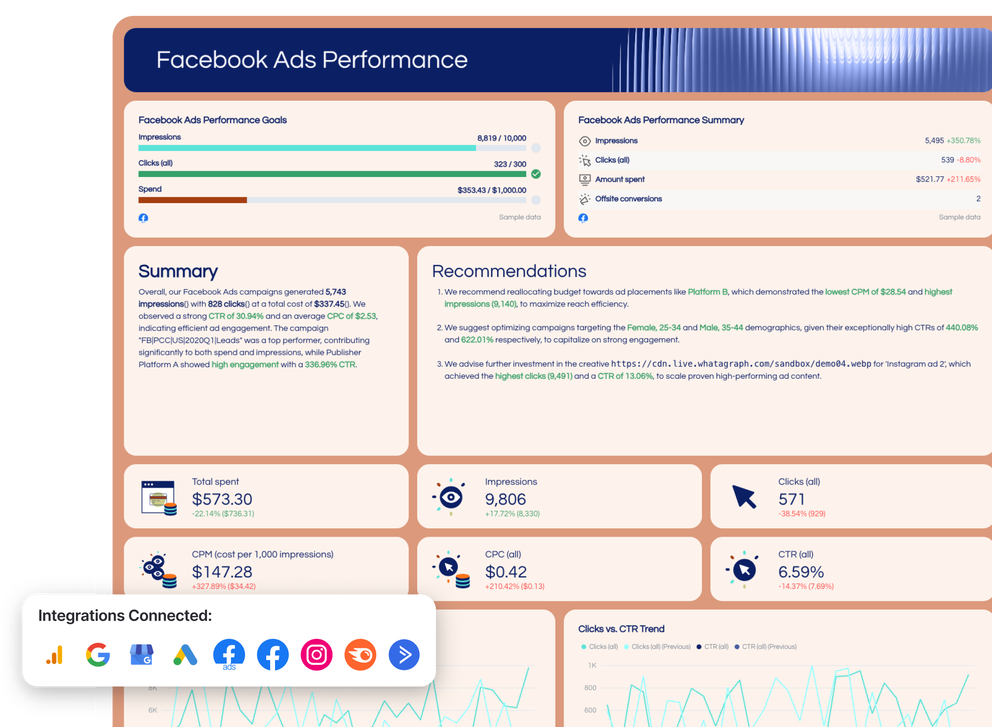
6. Facebook Ads
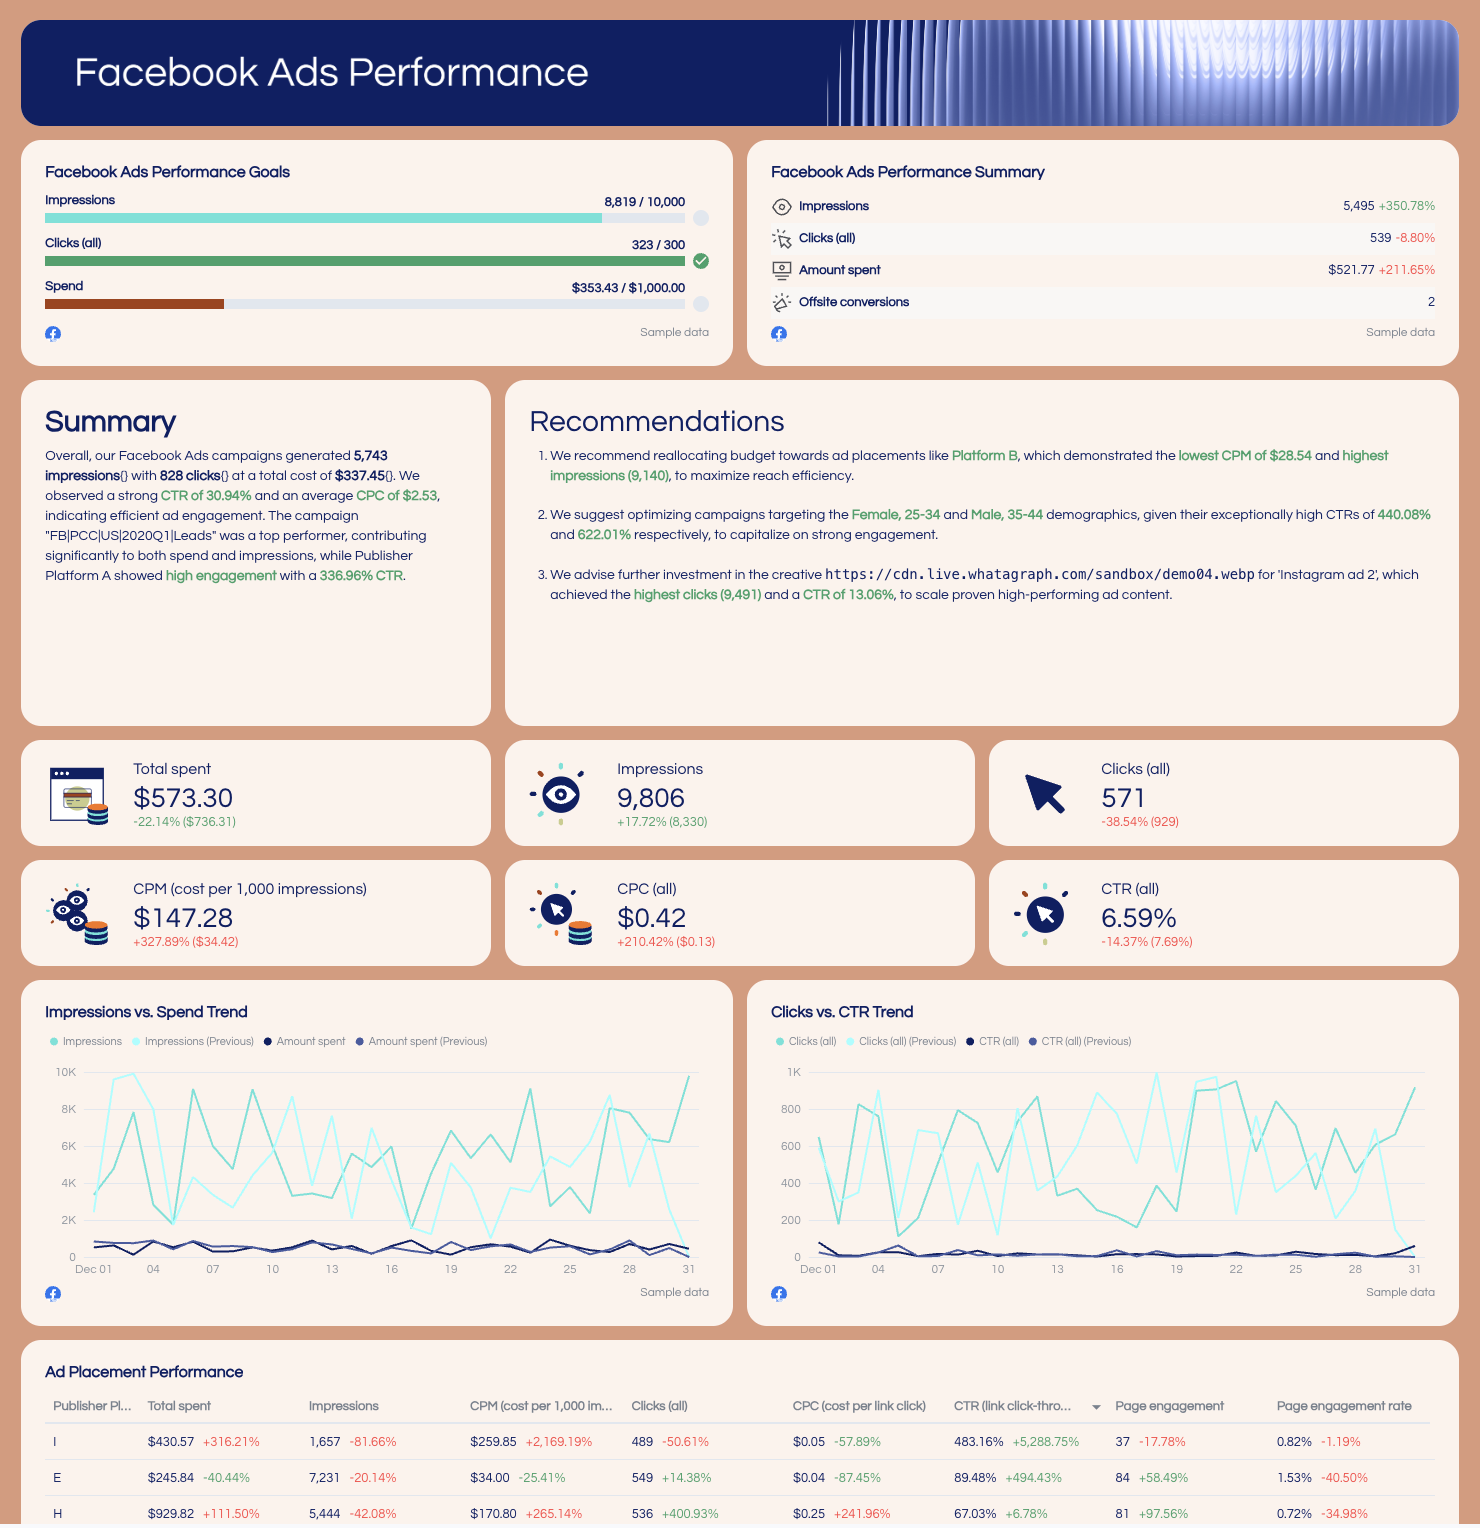
Purpose: Measure paid social efficiency, reach, and engagement.
Structure
- Summary + recommendations
- KPI tiles
- Spend & engagement trends
- Demographic analysis
- Creative and campaign breakdowns
Key metrics
- Impressions
- Reach
- Clicks
- CTR, CPC & CPM
- Spend
- Offsite conversions
- Engagement rate
Charts & visuals
- Line charts (spend vs impressions)
- Funnel chart (reach → clicks)
- Bar charts by age and gender
- Tables for creative, campaign, and demographic performance
7. Organic Social Media
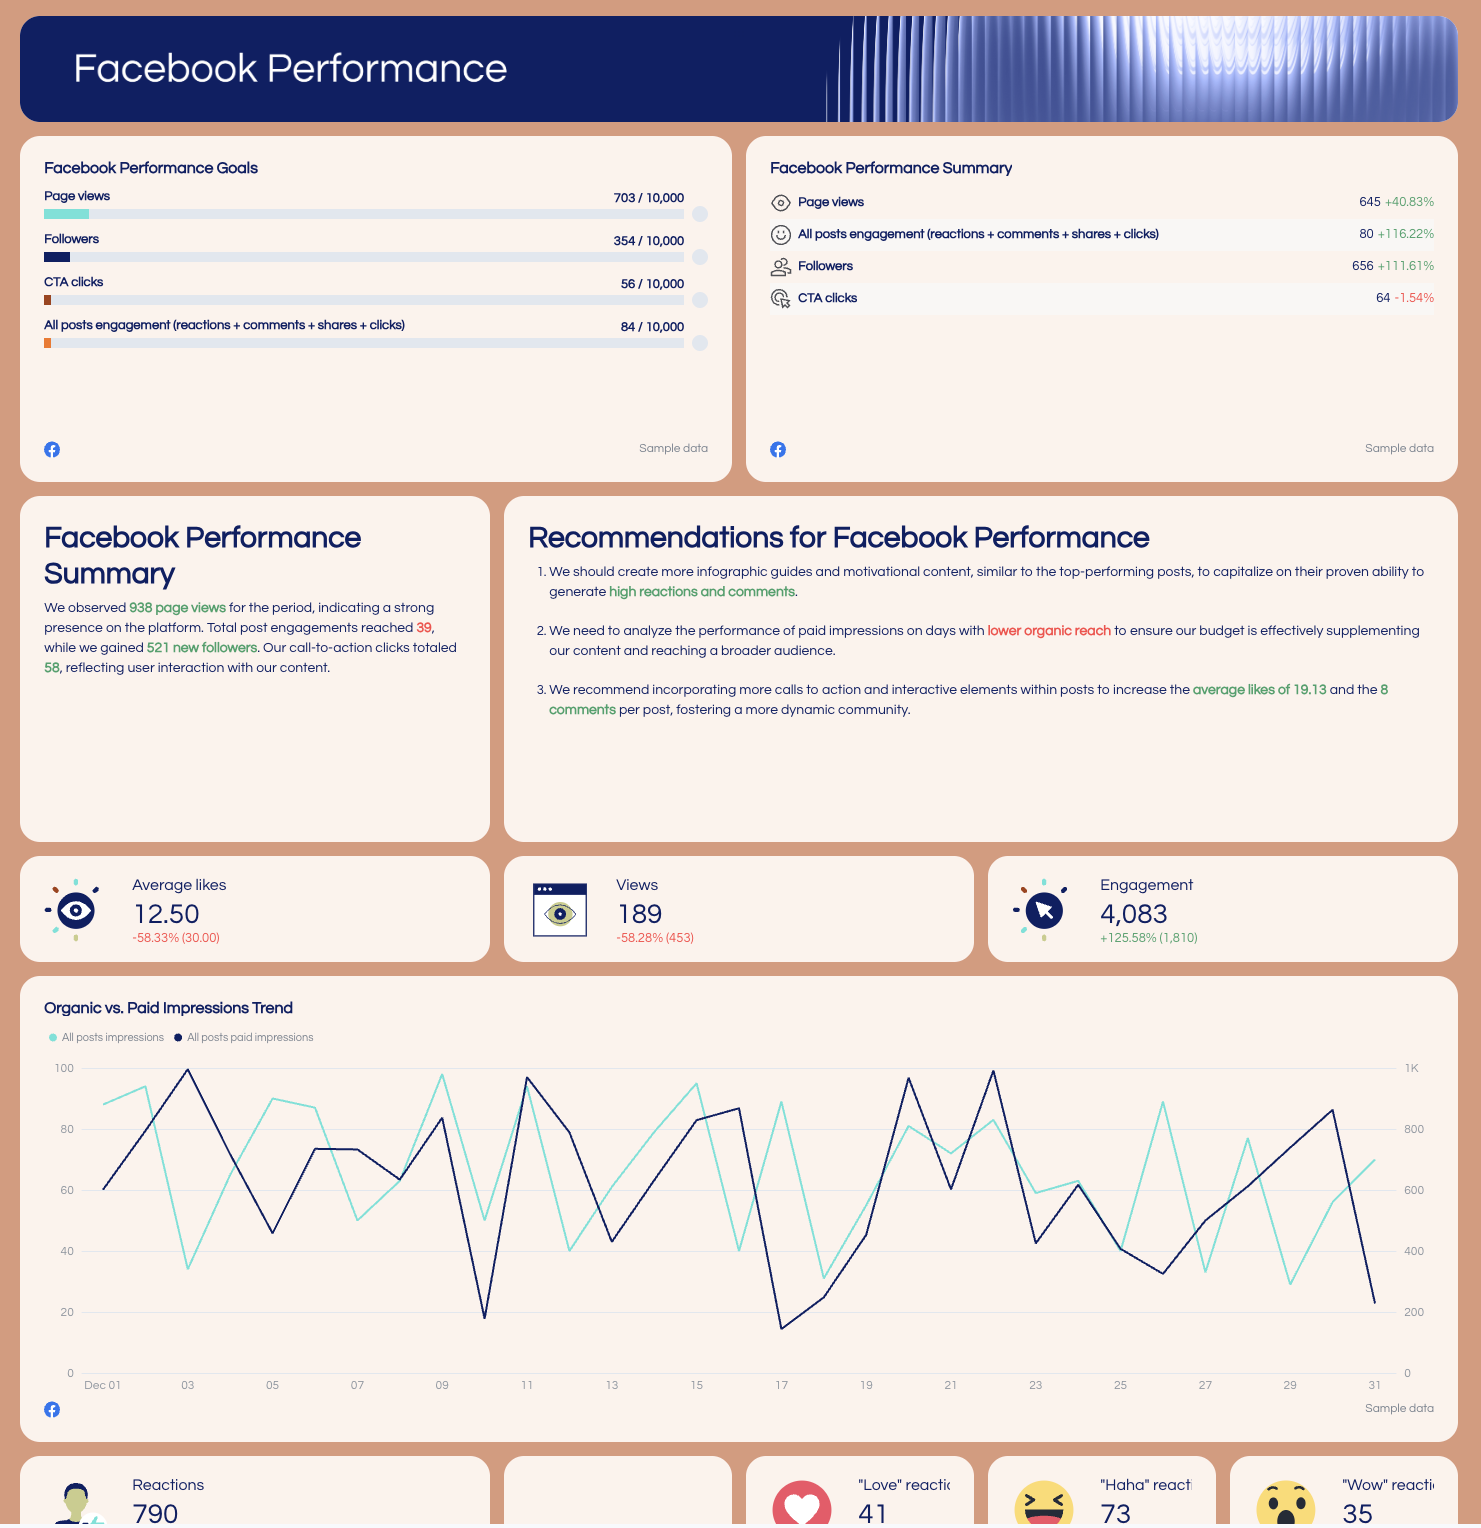 Purpose: Track non-paid social growth and engagement quality.
Structure
- Summary + recommendations
- KPI tiles by platform
- Growth and engagement trends
- Platform comparisons
Key metrics
- Followers
- Follower growth
- Impressions
- Engagements
- Engagement rate
- Clicks
Charts & visuals
- Line charts (follower growth)
- Bar charts (engagement by platform)
- Comparison tables (Facebook, Instagram, LinkedIn)
8. Email Marketing
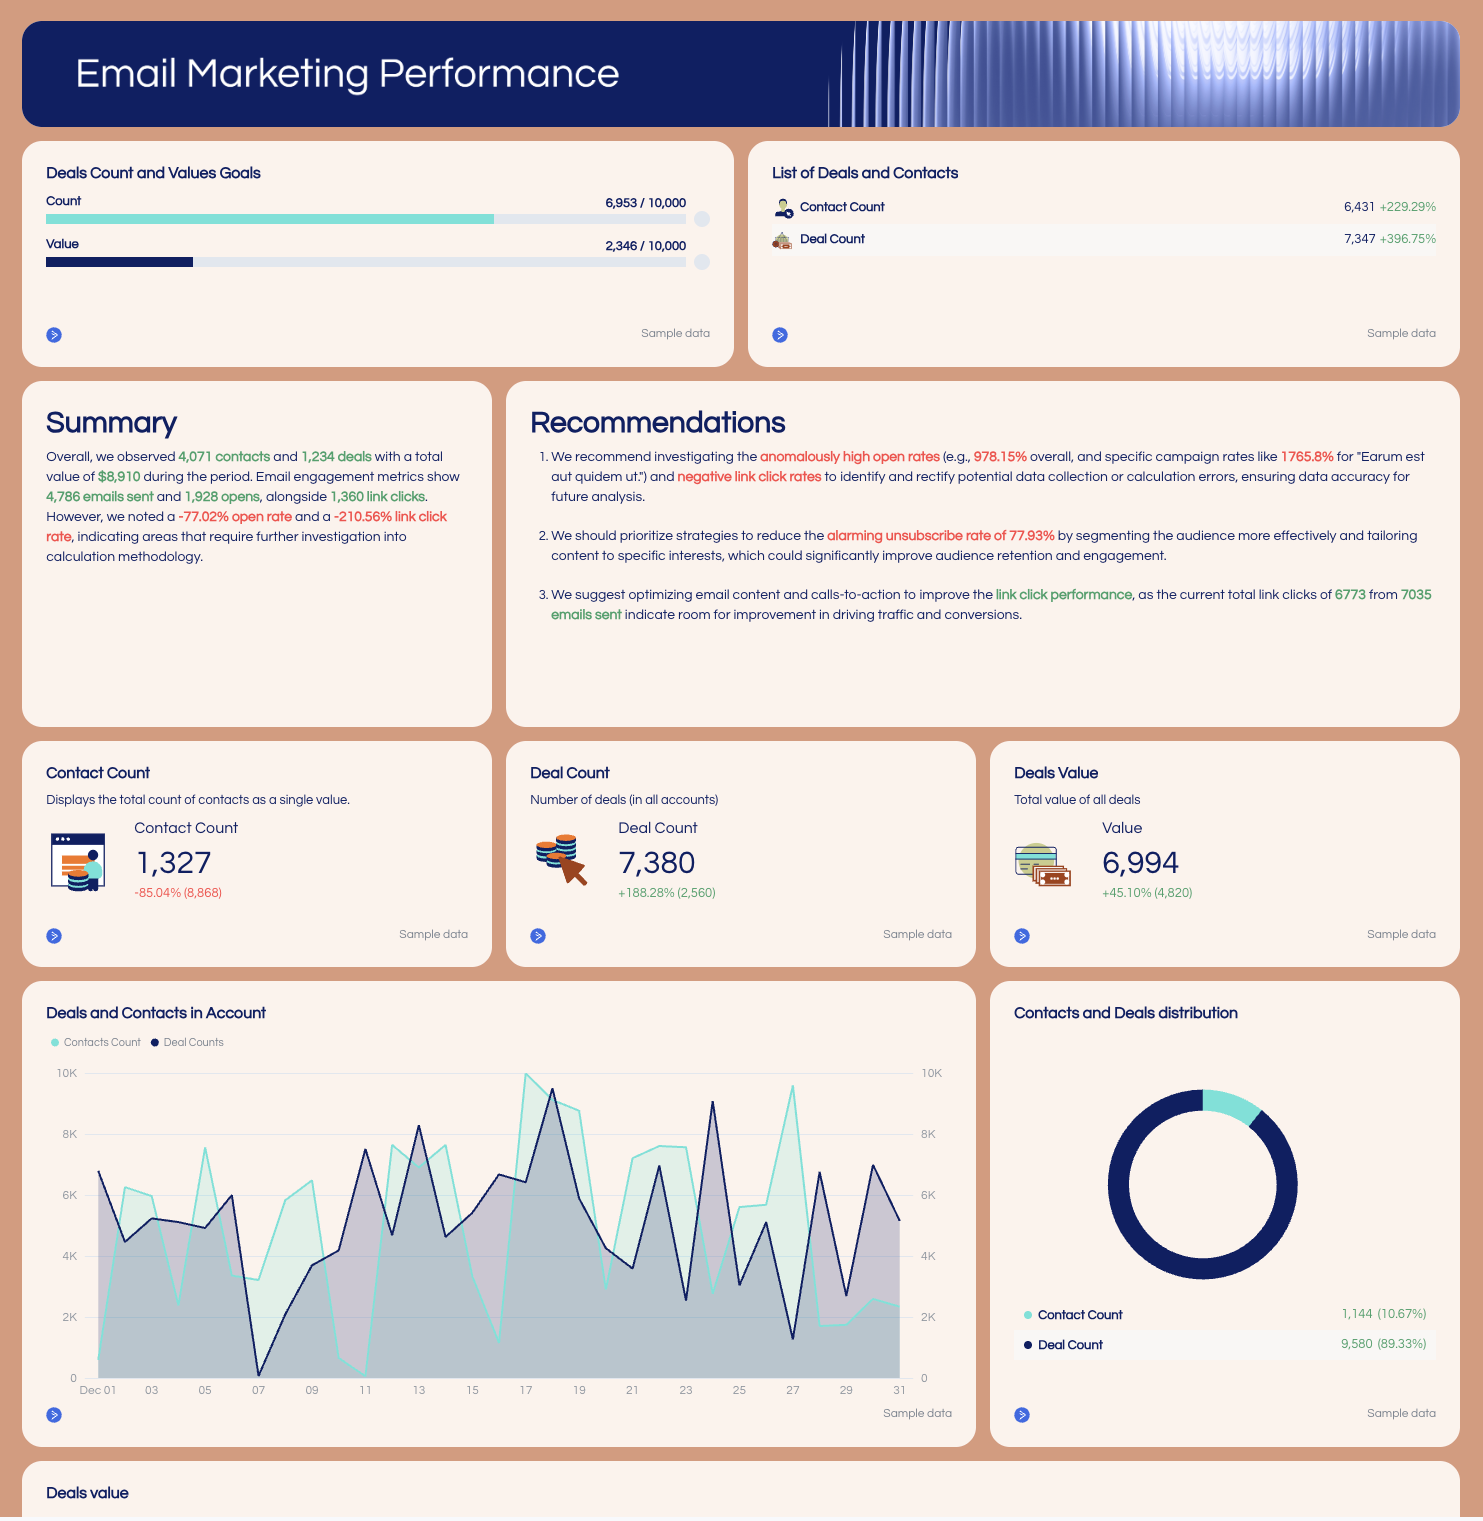
Purpose: Measure lifecycle and retention impact from email marketing.
Structure
- Summary + recommendations
- Email KPI tiles
- Campaign-level performance
- Trend analysis
Key metrics
- Sends
- Open rate
- Click-through rate (CTR)
- Unsubscribe rate
- Conversions
- Revenue (for ecommerce)
Charts & visuals
- Line charts (open and click trends)
- Bar charts (campaign comparisons)
Tables for Mailchimp or ESP campaign performance


