


TL:DR
Whatagraph is an all-in-one agentic marketing intelligence platform. It pulls data from 60+ marketing platforms into one governed data layer, turns it into white-labeled client reports, and puts AI agents to work on top of it to build, update, and monitor your reporting with humans in the loop at every stage.
Who it’s best for:
Mid-size agencies (30–100 employees) managing multi-channel PPC, SEO and social for 15+ clients, and multi-location businesses that need consistent reporting and brand governance across every account.
Key features at a glance:
| Feature | Whatagraph |
| Integrations | 60+ native integrations, plus custom API integrations built by agents for any tool with an API |
| Connection stability | Integrations built and maintained in-house; 30-minute data refresh on every plan |
| Governed data layer | Native blends, source groups, and custom metrics and dimensions, defined once and used everywhere |
| AI capabilities | Whatagraph IQ Agents, MCP support for Claude and ChatGPT, HTML and deck outputs, custom integrations built by agents |
| Report automation | Linked master templates, scheduled delivery, and “review before sending” approvals |
| White-label reporting | Custom branding on every plan; custom report domain as a Prime add-on |
| Security | ISO 27001 certified, GDPR compliant, EU data hosting and processing |
Pros ✅
- A wide span of integrations and a build-your-own option with agents
- Governed data foundation with defined metrics and standardized dimensions that feed your reports, dashboards, and AI tools
- Agents that onboard clients, build reports, and write commentary in your house style
- Account monitoring with digests sent to Slack, so issues surface before clients notice
- Flexible and white-labeled report sharing and automation
- A dedicated Customer Success Manager on every plan
Cons ❌
- Higher starting price than entry-level tools, with no free plan
- Built for marketing data, not finance or ERP databases
- Steeper learning curve for advanced setups like data warehouse exports, which are only available on Prime
Why You Can Trust This Review
At Whatagraph, we’re constantly using our own tool. Of course, we also sell it, which could make any review we write seem biased. But our bread and butter is helping marketers, not misleading them.
Here are the steps we took to keep ourselves honest:
- Hands-on testing: I went into the Whatagraph platform and set it up as if I was using it for the very first time, connecting the usual agency tech stack. I then built reports, blends, and custom metrics from scratch before handing off reporting to the IQ Agents available in the platform.
- Fact-checked live documentation: I scanned ruthlessly through pricing pages, plan limits, integration details, and security claims so that all the information in this review is accurate and up-to-date as of October 2026.
- Considered the real experiences of real users: I combed through recent (and verified) Whatagraph reviews on third-party sites like G2 and Capterra. Positive experiences mattered as much as the negative ones, and you’ll see both reflected here.
- Timed the help desk: I sent a message to their platform chat with an ordinary “how do I…” question and clocked how long it took to get a useful answer from a human.
- Scored the platform against agency must-haves: I judged integration breadth and stability, data governance, how far the AI actually goes, client-ready reporting and white-labeling, and security, all from the point of view of an agency juggling 15+ clients across multiple ad platforms.
Our goal is to help you make an informed decision by being as honest as we would when writing any other tool review.
Whatagraph Pricing: How Much Does Whatagraph Cost?
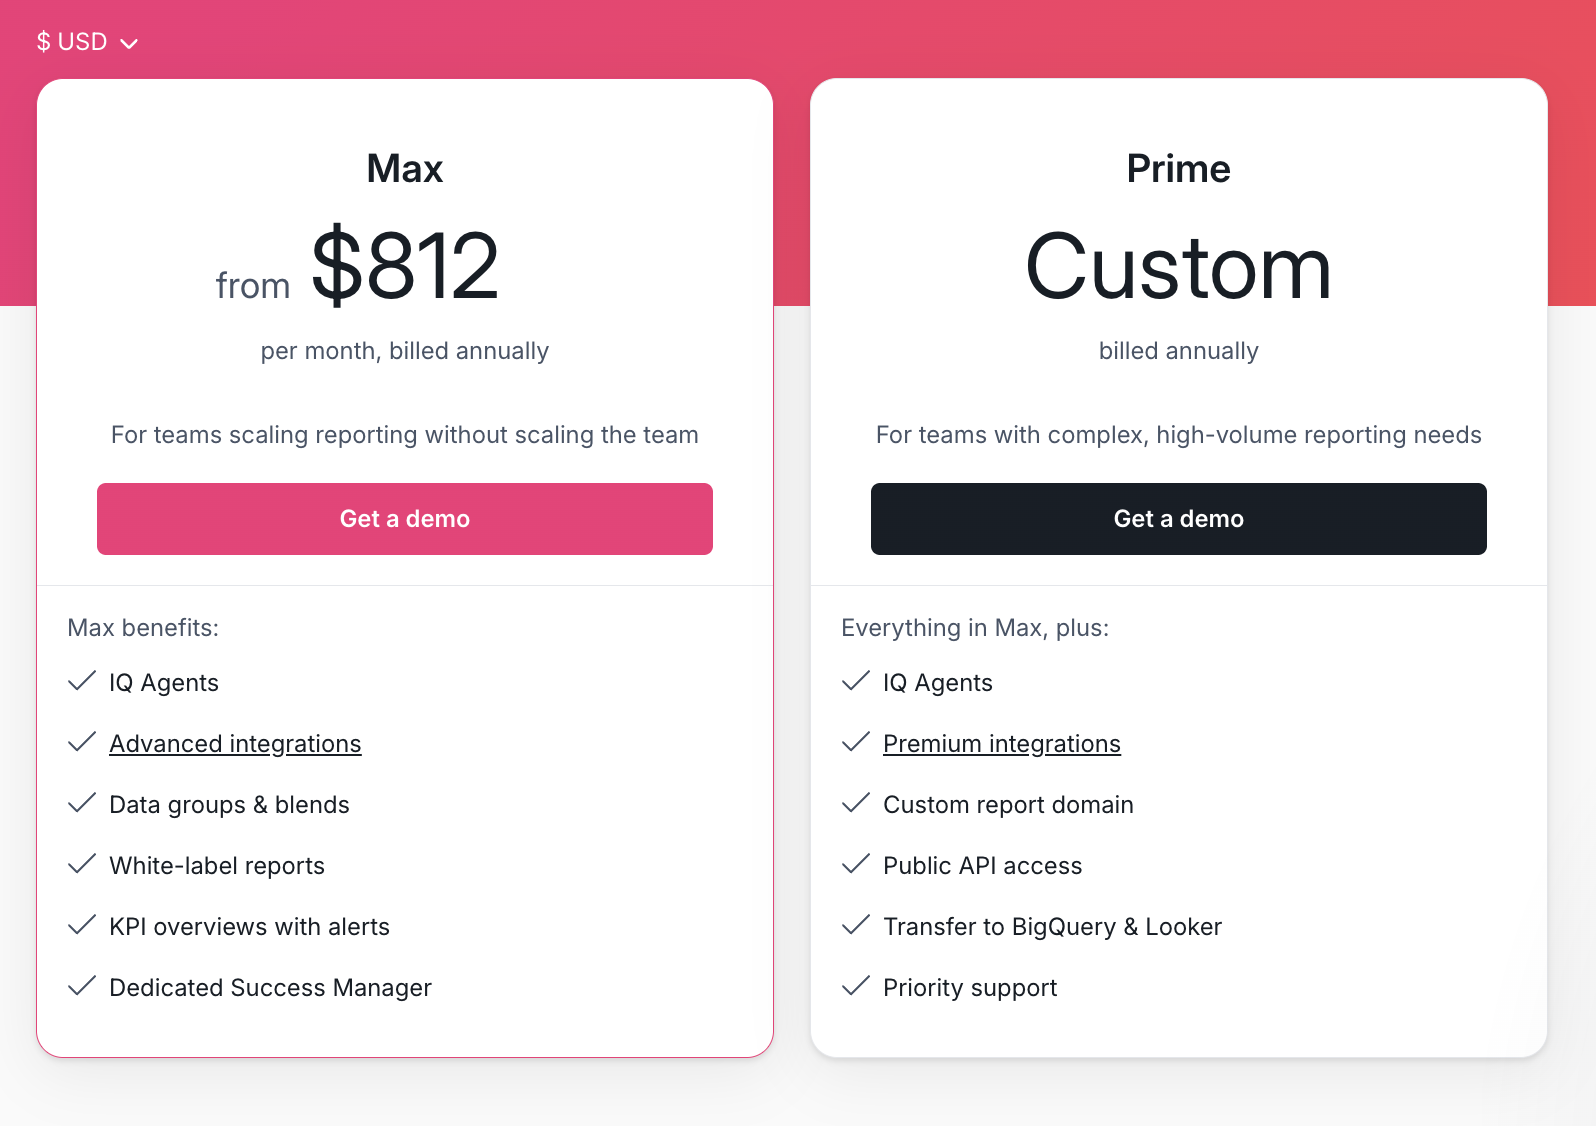
Whatagraph pricing keeps things simple. There are two plans, both billed annually, and both priced on the number of data sources you connect.
The Max plan starts from $812 per month. The Prime plan is built around each company’s unique reporting needs, so every quote is custom.
One source credit equals one connected data account. For example, one Google Ads account = one credit.
If a client runs Google Ads, Meta Ads, GA4, and LinkedIn Ads, that’s four credits, so by my calculation 50 credits cover roughly 12 clients.
Users on the platform and reports generated don’t change what you pay.
Whatagraph doesn’t punish you for growing your agency. You can add your whole team, onboard unlimited clients, and build as many reports as you like without the bill moving. If you do run out of credits, you can buy extras until you hit the next plan threshold, at which point you’ll find it’s time to move up to Prime.
Both plans come with IQ Agents on Base usage, so you don’t buy them as a separate product.
If your agents take on more work, you can move up a usage tier:
| Agent capability | Base (every plan) | Mid | Heavy |
| Reporting workflows, monitoring and alerts | ✅ | ✅ | ✅ |
| Managed MCP | ✅ | ✅ | ✅ |
| Computer use and browser | ❌ | ✅ | ✅ |
| AI visibility | ❌ | ✅ | ✅ |
| Video and motion ads | ❌ | ❌ | ✅ |
Whatagraph pricing for Mid and Heavy agent use are put together as part of a custom pricing package.
What does Whatagraph’s pricing mean for your budget?
- Count your credits before the call: Multiply your clients by the platforms you report on. If the total is well above 50, you’re likely in extra-credit or Prime territory, so expect a custom quote.
- Some agency must-haves sit on Prime: A custom report domain (reports.youragency.com), BigQuery transfer, SAML SSO, and the public API are all Prime add-ons. White-label branding itself is on Max, the custom domain isn’t.
- Agents are included in the base price: Day-to-day agent work (reporting workflows, monitoring, alerts, MCP) is covered on Base. Heavier work, like computer use, browsing, and AI visibility, needs a higher usage tier.
- Support isn’t paywalled: Live chat and a dedicated Customer Success Manager come with both plans. Prime adds tailored onboarding, priority support, and an SLA.
Heads up: There’s no free plan and no monthly billing. Max is an annual commitment from day one, and moving onto either plan (or upgrading) means booking a call with the Whatagraph team. If you’re a freelancer or a small shop testing the waters, that’s a real barrier, and it’s deliberate. Whatagraph is priced for agencies that are scaling. Trials are available for selected teams.
What counts as a source credit?
Every connected account or property counts as one credit, whatever the platform.
So two GA4 properties are two credits, and five clients on Facebook Ads are five credits. A client with a Facebook Page, a Facebook Ads account and an Instagram account uses three.
A few things prospects ask about on top of that:
- Users and viewers are free. Add your whole team, and share reports with as many clients as you like. Clients don’t need a Whatagraph account to open a live link or a PDF.
- Source groups use a fraction of a credit per source. Rolling 25 Google Ads accounts into one group doesn’t cost another 25 credits. A group uses about one credit per 10 sources in it, per report type, with a minimum of one.
- Blends and data transfers are tracked separately in your plan usage. They don’t add to your connected sources count.
- You can check your count any time. The “Connected sources” number at the top of Data sources is what you’re using.
Max vs. Prime: which plan do you need?
Most agencies start on Max. Prime is for teams that need one of the rows below that Max doesn’t have, or more credits than Max covers.
| Feature | Max | Prime |
| IQ Agents (Base usage) | ✅ | ✅ |
| Advanced integrations | ✅ | ✅ |
| Premium integrations, like DV360 and Adobe Analytics | ❌ | ✅ |
| Blends, source groups, custom metrics and dimensions | ✅ | ✅ |
| Overviews with goals and alerts | ✅ | ✅ |
| Linked templates and white-label branding | ✅ | ✅ |
| Custom report domain | ❌ | Add-on |
| Transfer to Looker Studio | ❌ | ✅ |
| Transfer to BigQuery | ❌ | Add-on |
| Single sign-on | Google login | SAML add-on |
| Public API | ❌ | Add-on |
| Dedicated Customer Success Manager and live chat | ✅ | ✅ |
| Tailored onboarding, priority support, enterprise SLA | ❌ | ✅ |
| Users and reports | Unlimited | Unlimited |
| Source credits | From 50 | Custom |
If reports on your own domain or data in BigQuery is a must-have for your clients, start the conversation at Prime.
Is it cheaper to build your own reporting stack?
At first? Sometimes, yes. A subscription is only one line on the bill, though. To compare fairly, you have to count everything you’d otherwise pay for, and the hours that never show up on an invoice.
If you’re an agency running 25 clients across 6 channels (say Google Ads, Meta Ads, LinkedIn Ads, TikTok Ads, GA4, and Search Console). That’s 150 connected accounts, which is 150 source credits on Whatagraph.
The alternative most agencies at this size weigh up is building it themselves, with an in-house data team or with AI tools like Claude.
A working dashboard comes together fast that way. What gets expensive is the foundation underneath it.
Marketing platforms update their APIs three to four times a year (TikTok alone has shipped 51 Ads API updates since 2020).
For your agency that means roughly 18–24 API changes a year across six platforms, rippling through 150 connections that someone has to keep alive.
| For 25 clients × 6 channels | Build it yourself | Whatagraph |
| Connected accounts to keep alive | 150 | 0 (maintained by Whatagraph) |
| Platform API changes to handle per year | ~18–24 | 0 |
| Monthly report production* | ~100 hours | ~38 hours |
| Data layer, reporting, white-label, AI | Build and maintain each one | Included |
| Licence | Tools + AI usage | Prime, custom quote |
* This is based on Peak Seven’s figures: their reports took about 4 hours each with Looker Studio, and 1.5 hours or less on Whatagraph, across 25 clients a month. Your numbers will vary with report complexity.
Building does make sense in some cases. It’s a fair call if you already have a BI team and a warehouse running, if owning the pipeline end to end is a genuine strategic goal, or if your data setup is too unusual for off-the-shelf software.
Get a complete breakdown in this build vs. buy reporting stack guide.
Can you pay monthly, or cancel anytime?
No to monthly. Both plans are annual, billed in advance.
Here’s how cancelling works:
- Tell the team at least 30 days before your renewal date, through live chat or support. Otherwise the plan renews for another term.
- You keep full access to your reports and data until the end of the term you’ve paid for.
- Payments aren’t refundable.
When you leave, removing a source schedules its stored data for deletion after a grace period of a few days. You can also request a full erasure of your account data under GDPR, and those requests are acknowledged within 72 hours.
Real User Reviews: What are users saying about Whatagraph?
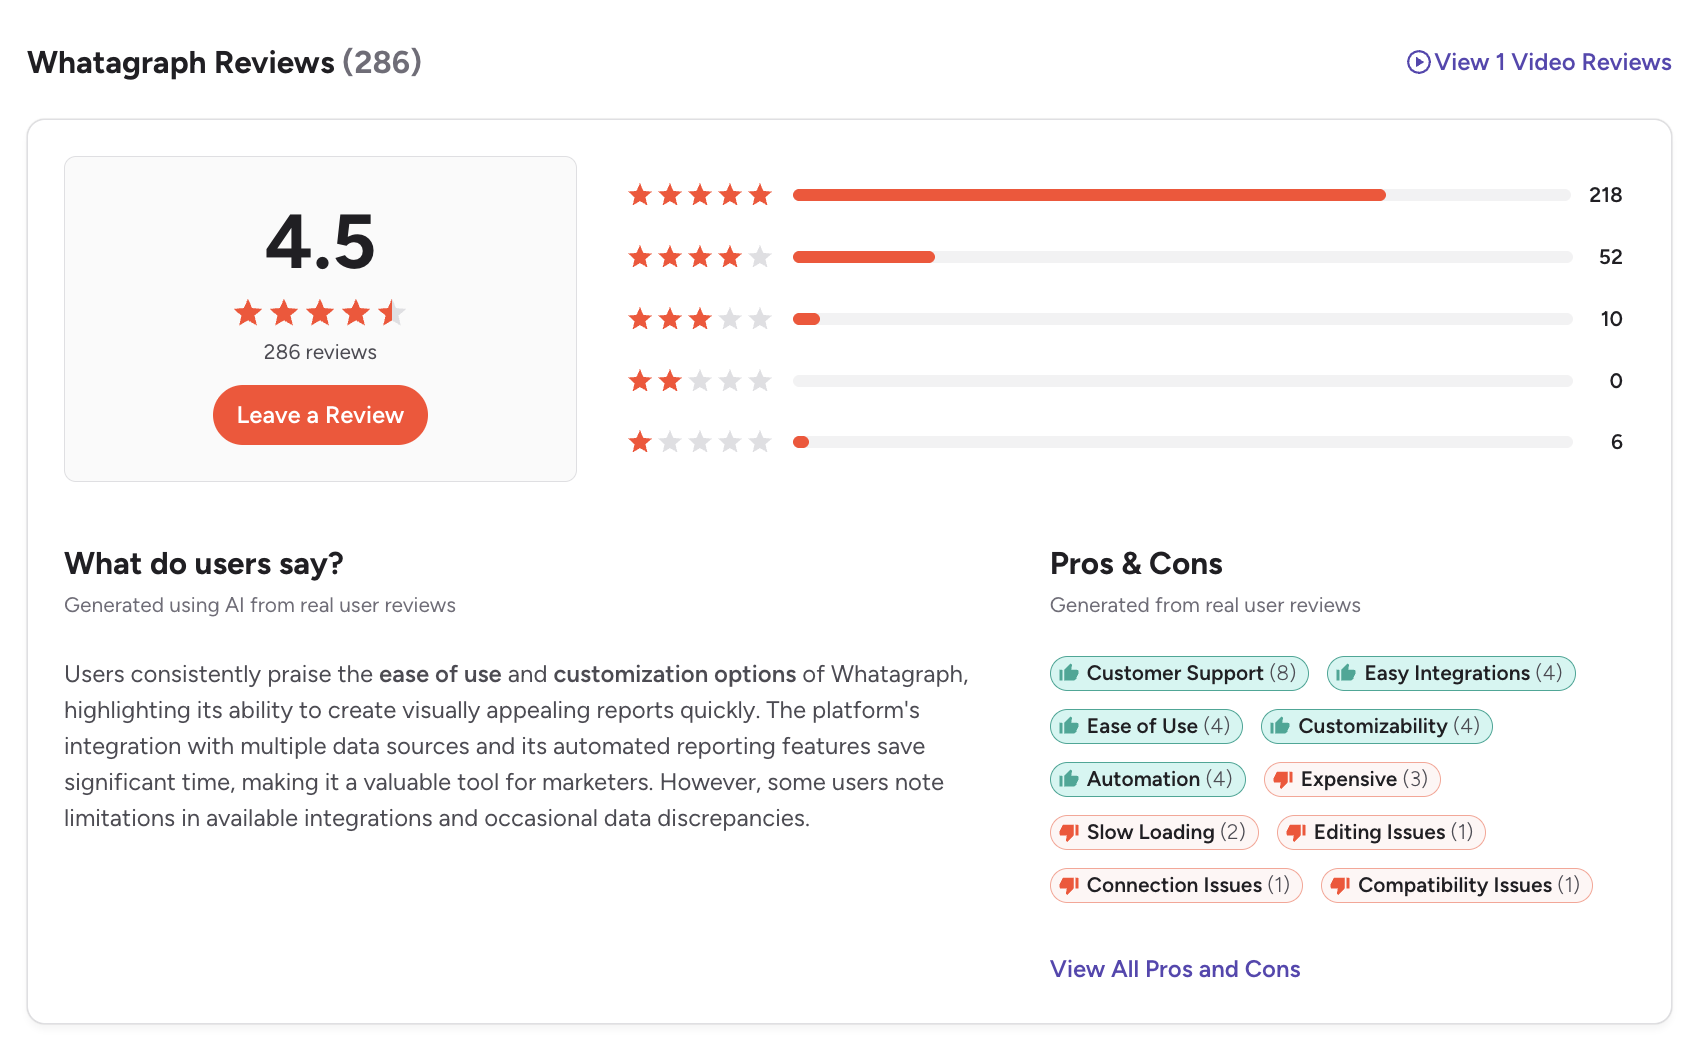
You could spend hours on G2 and Capterra reading hundreds of Whatagraph reviews. But who wants to? So, I’ve done the hard work for you, finding the common threads across users with praise and complaints about their Whatagraph experience.
| Overall Whatagraph G2 rating* | 4.5/5 ⭐ (286 reviews) |
| Overall Whatagraph Capterra rating* | 4.4/5 ⭐ (84 reviews) |
*As of October 2026
Across these Whatagraph reviews, I noticed a clear pattern: users rave about the output. Reports their clients actually understand, a support team that knows them by name, and hours handed back every month.
Capterra’s 4.6 rating for customer service backs that up. Where reviewers do hesitate, it’s mostly about whether Whatagraph is the right size for their agency.
One thing to keep in mind is that almost every review predates IQ Agents, which became generally available in October 2026.
So these reviews are about Whatagraph’s reporting platform. The agents are too new to have a review track record yet, so I’ve covered how they work, and what I found testing them, in Feature Deep Dive #3.
Let’s break it down.
Whatagraph pros: What users love
✅ Reports clients actually understand
This is the most consistent praise, and it shows up in recent reviews, not just old ones.
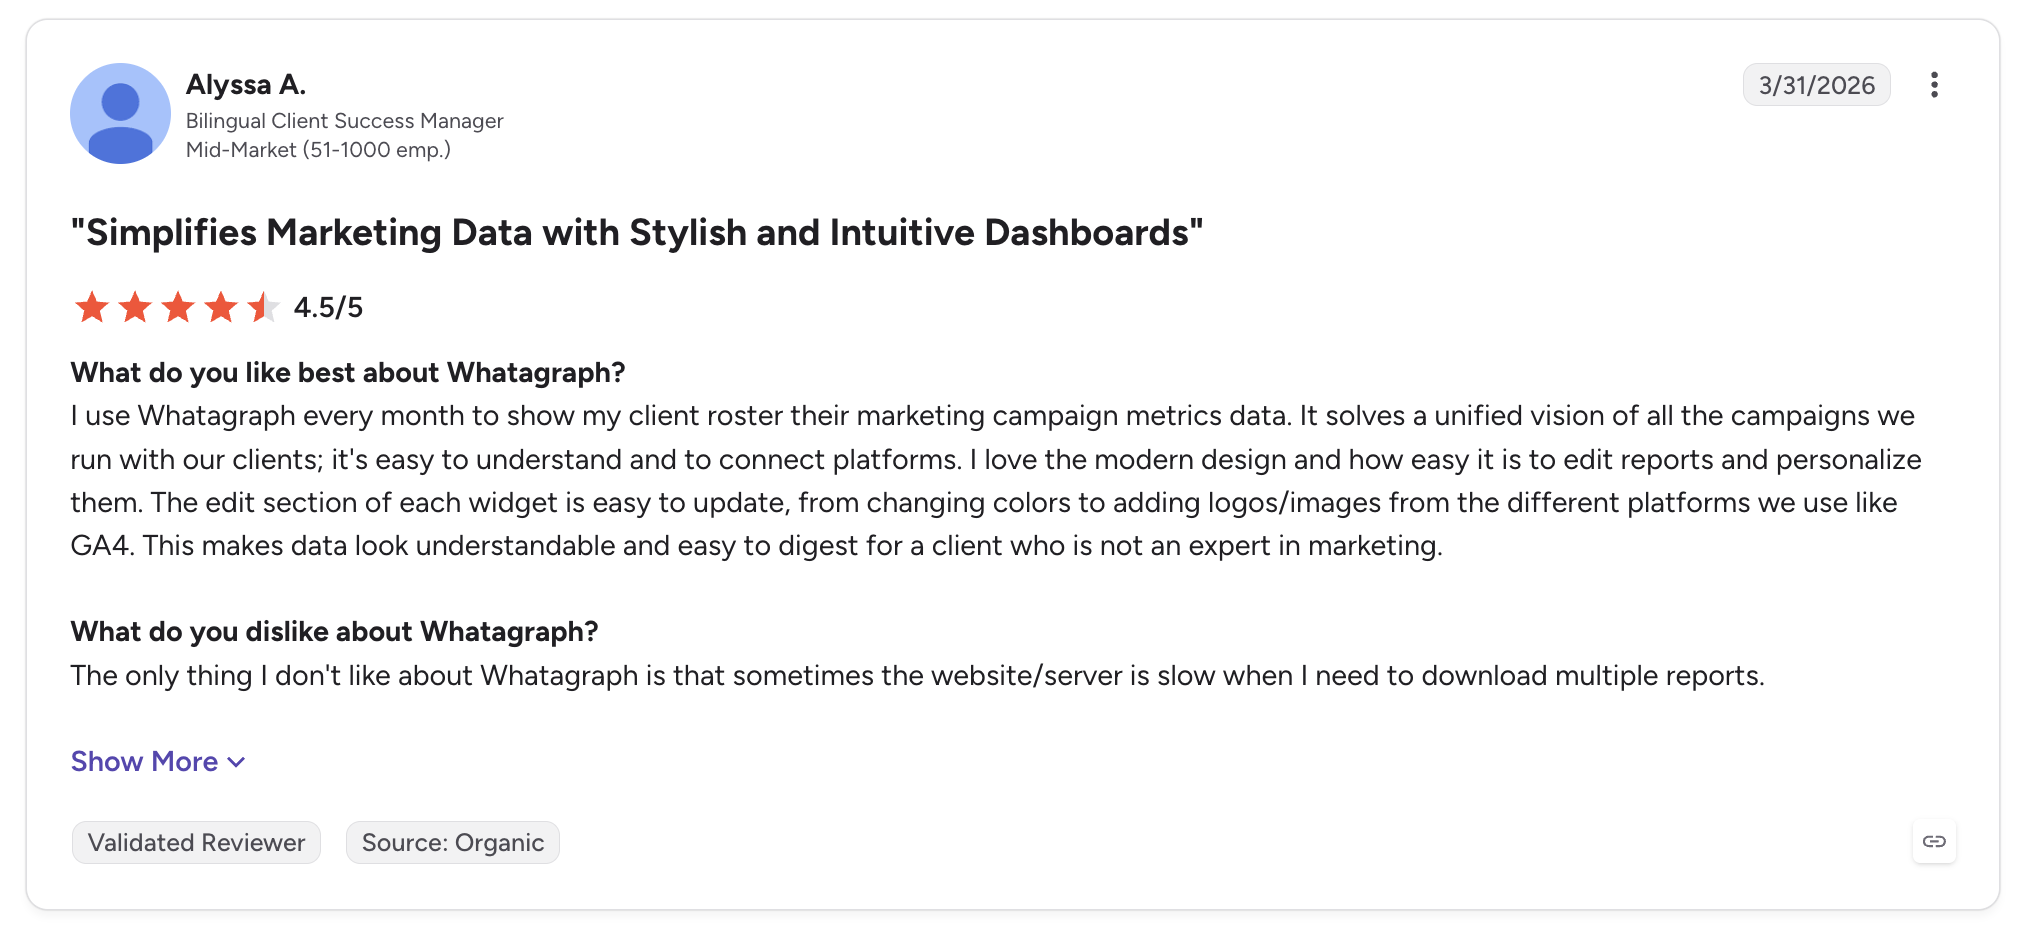
Alyssa A. on G2 uses Whatagraph every month to report to her client roster. She says it’s “easy to understand and to connect platforms.”
She also likes how easily she can edit widgets (colours, logos, platform images) so non-marketers can actually digest the data.
✅ Connections that are simple and stay connected
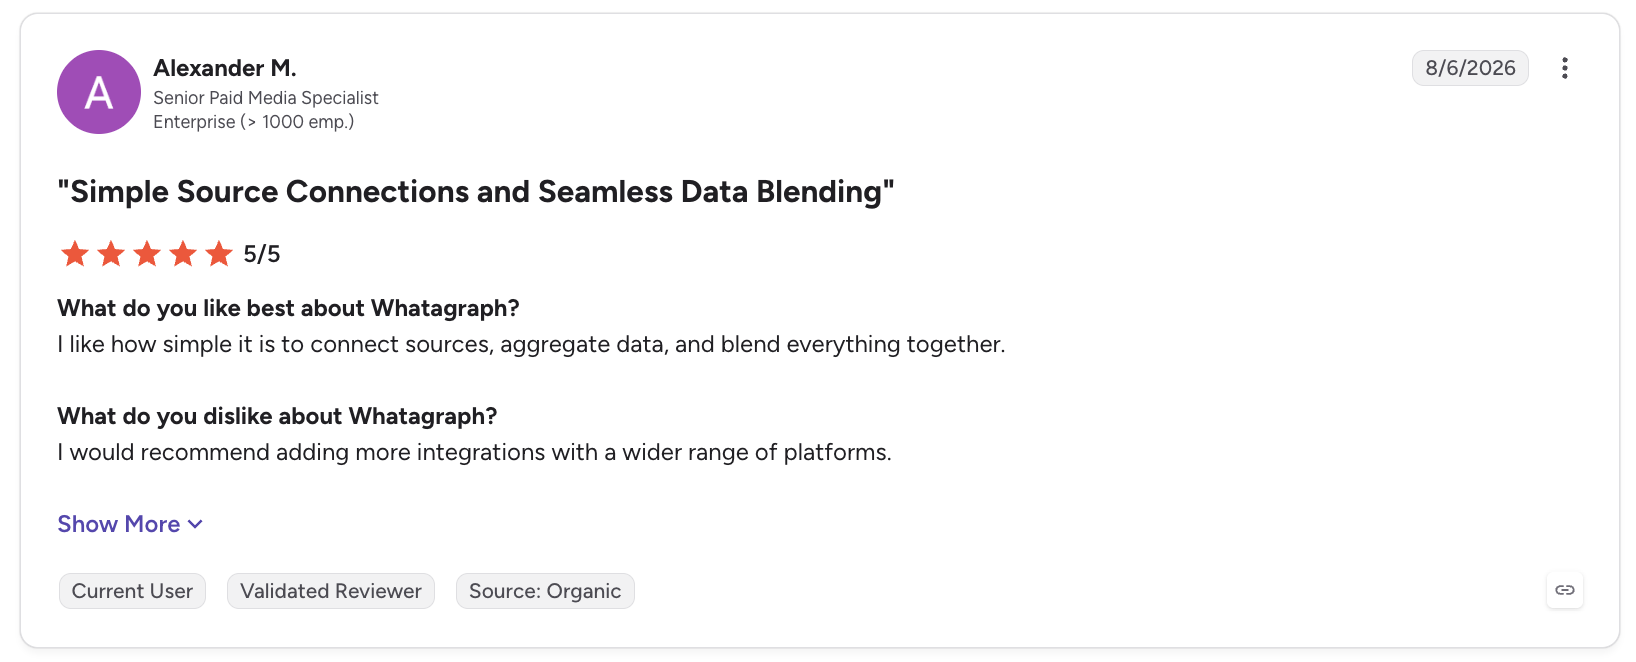
Alexander M., a Senior Paid Media Specialist at an enterprise company, likes how easy it is to connect sources, aggregate data, and blend everything together.
Anna A., a Director of Analytics, specifically calls out that the API integrations are maintained proactively. She also found the initial setup easier than she expected.
✅ Support that’s oh-so-quick
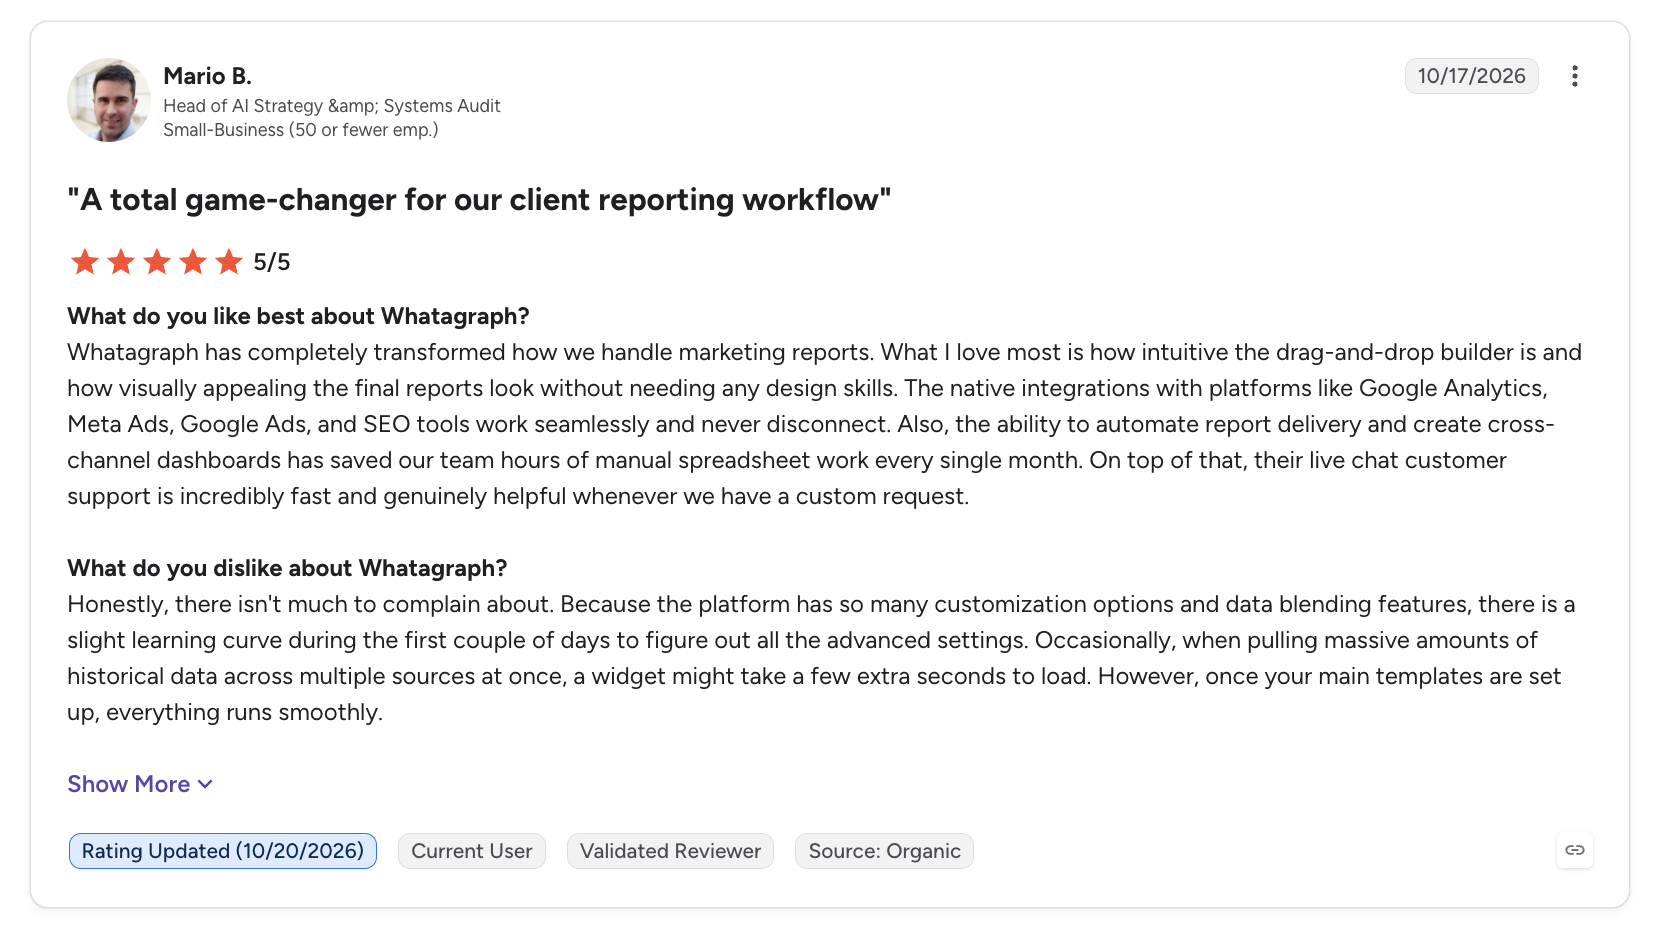
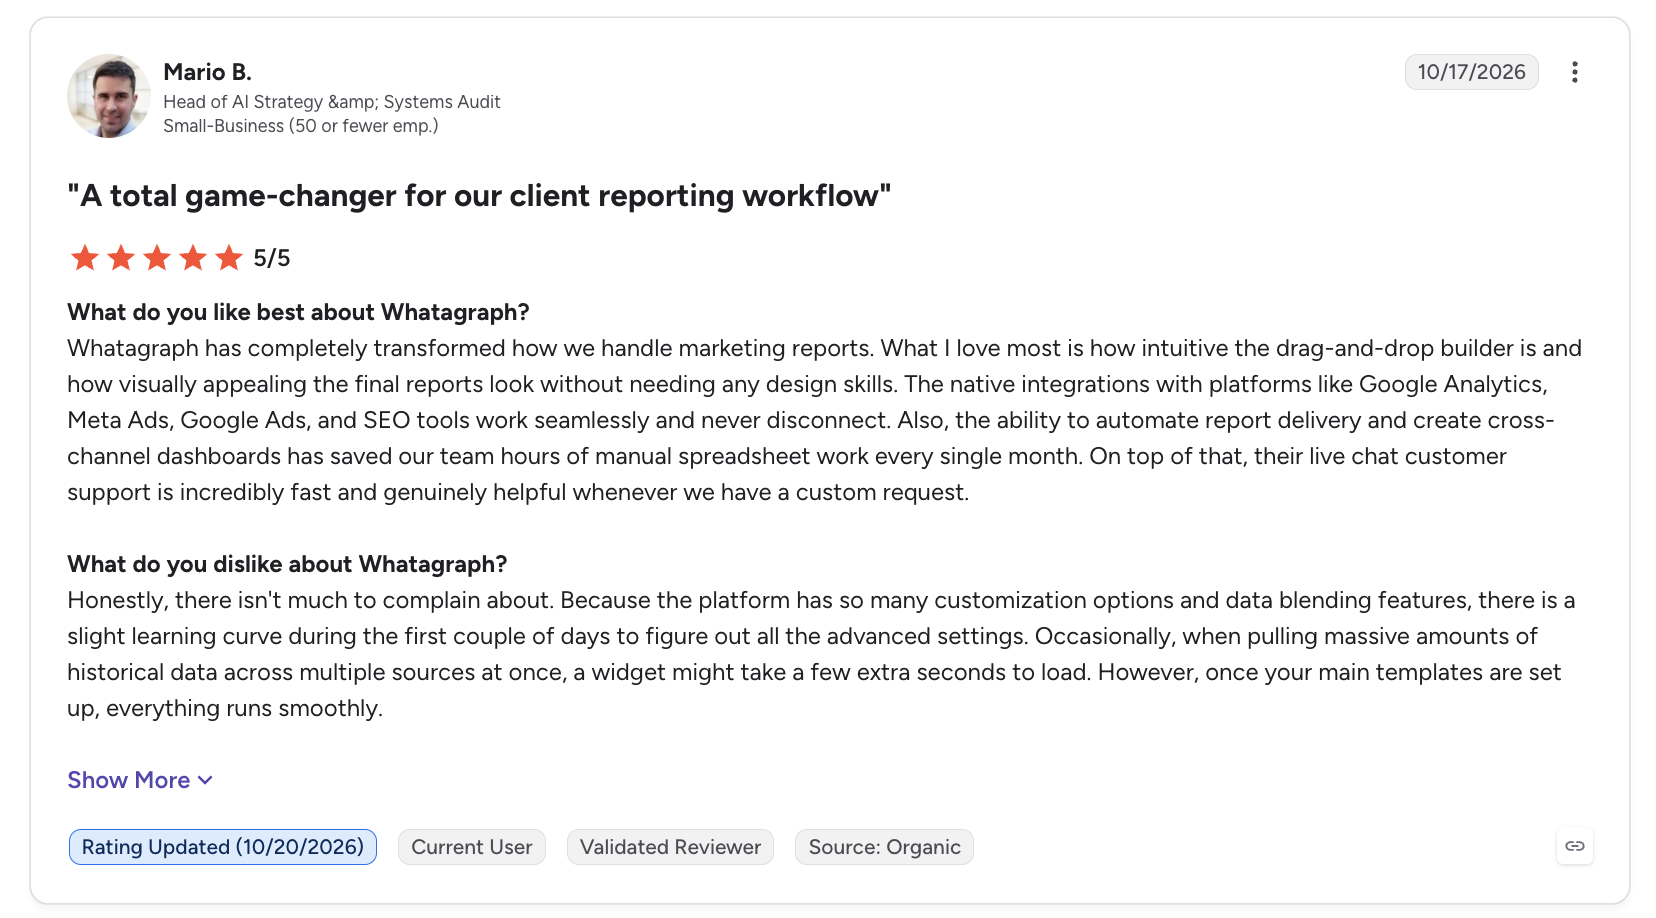
Customer support tops G2’s list of what reviewers like. Mario B., Head of AI Strategy at a small agency, calls the live chat “incredibly fast and genuinely helpful,” even when he has a custom request.
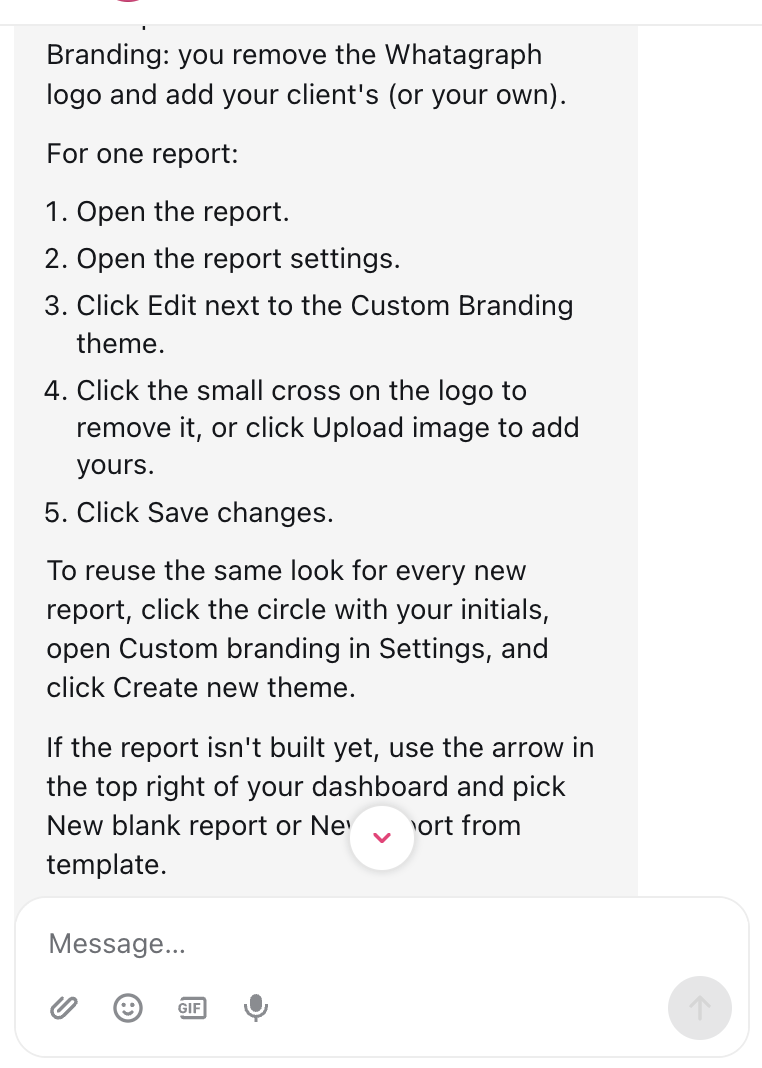
I was interested in seeing how quick our support team is myself, so I jumped in as a normal user of Whatagraph would and put in a support request. I got my response in less than two minutes. And it was ultra-detailed support, not just a generic ‘how may I assist?’ response.
✅ Agencies get precious hours back every month
Mario B. (remember him?) says his team has cut its monthly reporting time by at least 80%. That’s the time they used to spend pulling CSVs, taking screenshots and pasting data into presentations.
Whatagraph’s own case studies show similar results. Peak Seven reports for 25 clients and each report used to take 4 hours in Looker Studio. Now, using Whatagraph, it takes 1.5 hours or less, saving the team 63 hours a month.

Where Whatagraph Users Get Frustrated:
❌ It’s an investment, priced for agencies that are scaling
Price is the most common hesitation in G2’s review summary.
Whatagraph is built for agencies juggling a growing client list, where the time saved across dozens of reports justifies the cost. So, if you’re running a handful of clients or just a hobbyist, a lighter tool may suit you better for now.
❌ Custom metrics reward upfront planning
Even happy users mention a ramp-up. Mario B. says that with so many customization and data blending options, it took his team a couple of days to figure out the advanced settings. After that, once the main templates were set up, everything ran smoothly.
❌ Users want even more integrations
Both Alexander M. and Anna A. would like integrations with a wider range of platforms.
Whatagraph’s answer is now IQ Agents, which can build a custom API integration for any marketing tool with an API. There will be more on how that works in Feature Deep Dive #1.
If you’re managing a growing client list across multiple channels, the reviews say yes. If you’re a solo marketer on a tight budget, probably not yet.
Feature Deep Dive #1: Integrations & Data Reliability
Whatagraph has 60+ native integrations, all maintained in-house, with a 30-minute refresh on every plan. For anything not on the list, an agent can build the connection in minutes. The only real limit is that the tool needs an API.
For agencies, integrations are where reporting tools win or lose. You need to pull data from dozens of platforms for every client at any given time.
So, can Whatagraph get all your data into one place, and keep it there?
How many out-of-the-box integrations are there?
There are 60+ integrations available, all native and built by Whatagraph.
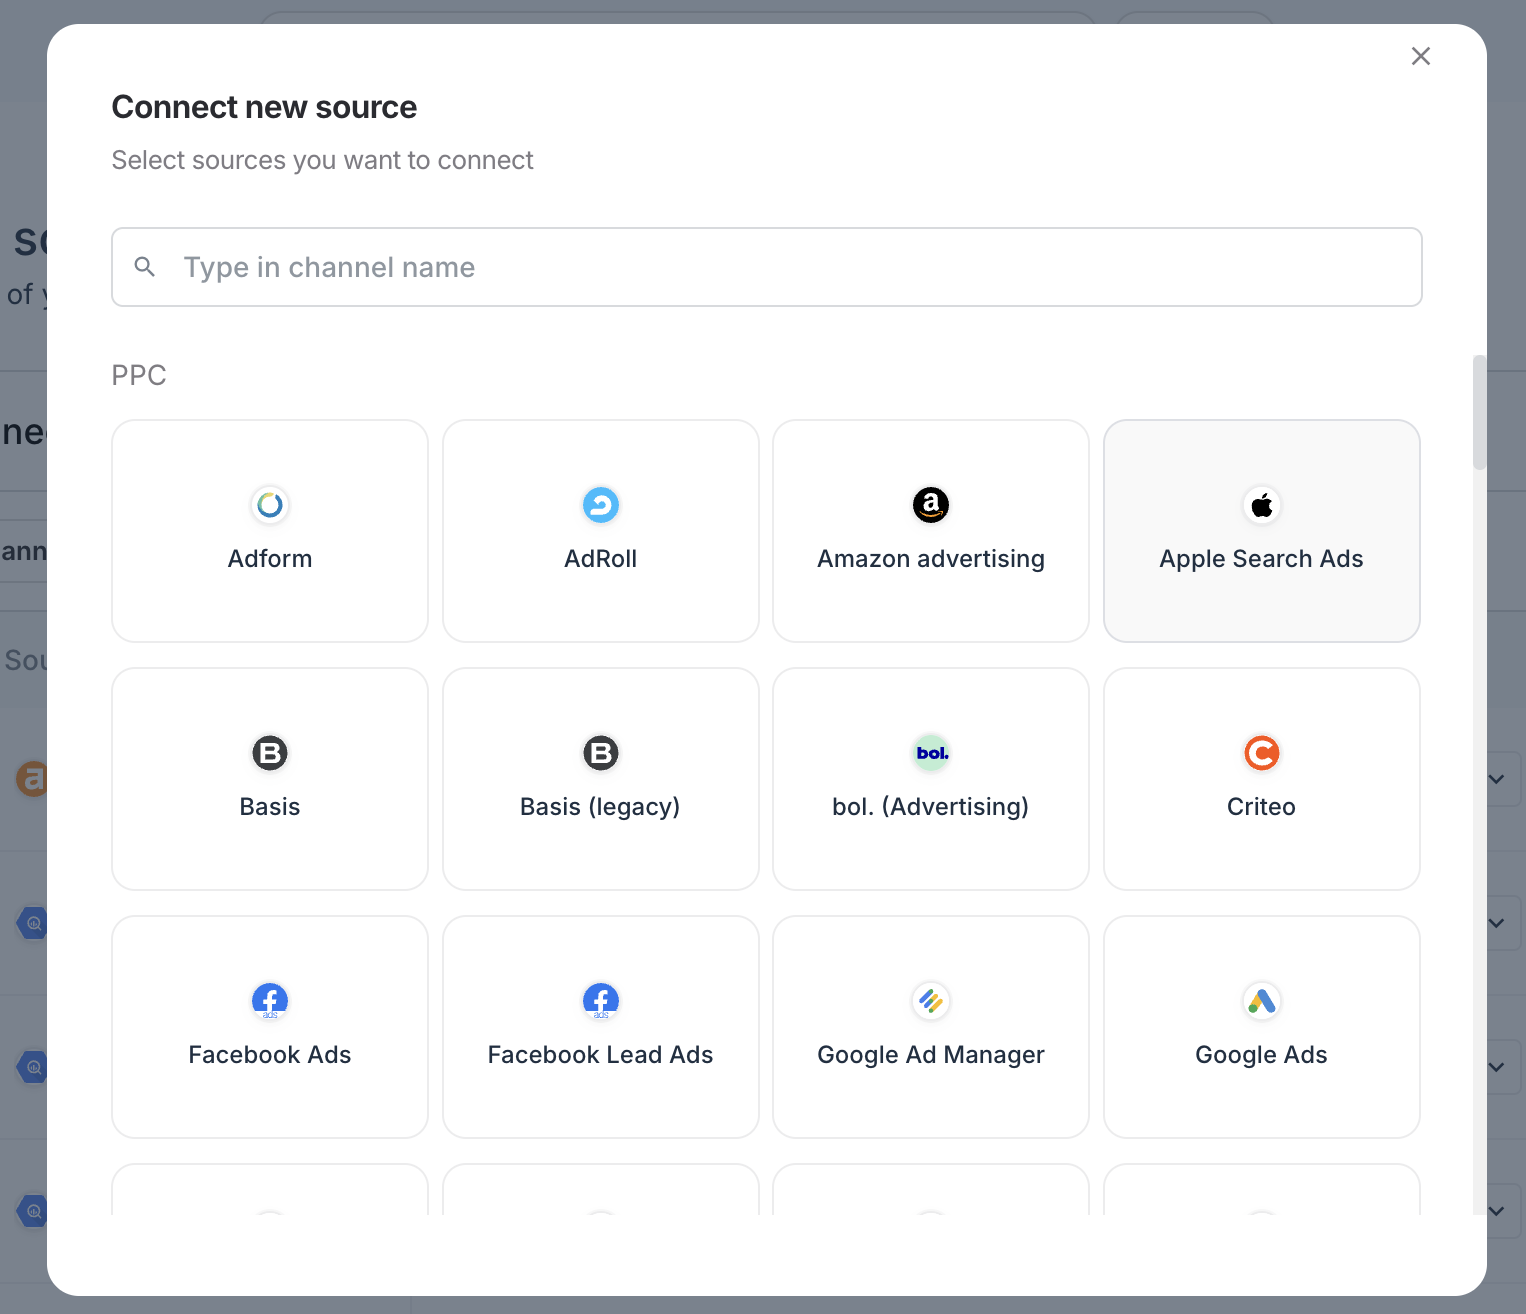
That’s fewer than tools that advertise hundreds of connectors, but more isn’t always better. Here’s what you should know:
- The big ad platforms are all there: Google Ads, Meta, LinkedIn, Microsoft, TikTok, Amazon, plus programmatic platforms like The Trade Desk, StackAdapt and DV360.
- So are the niche ones clients ask for: SE Ranking, AppsFlyer, bol.com, CallRail, and even OpenAI Ads.
- A few are Prime-only: premium integrations like DV360 and Adobe Analytics need the higher plan.
You can see the full list on Whatagraph’s integrations page, or get a deeper breakdown in this guide to Whatagraph integrations.
What if a platform you use isn’t supported?
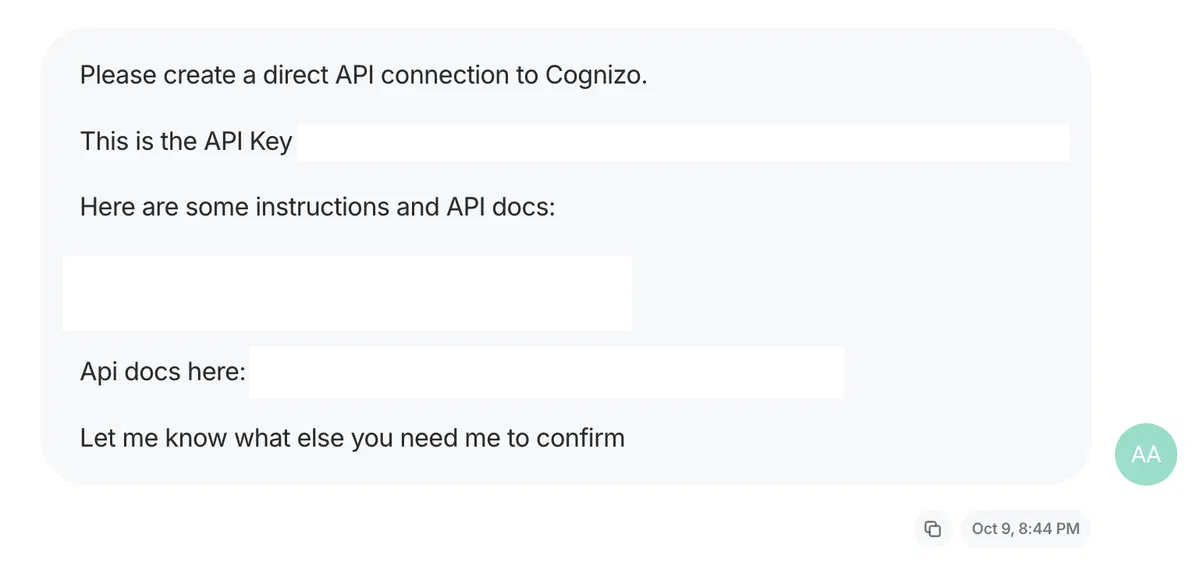
Before, that meant a Google Sheets workaround or a developer. Now that Whatagraph has introduced IQ Agents, you can use that capability to build the integration for you.
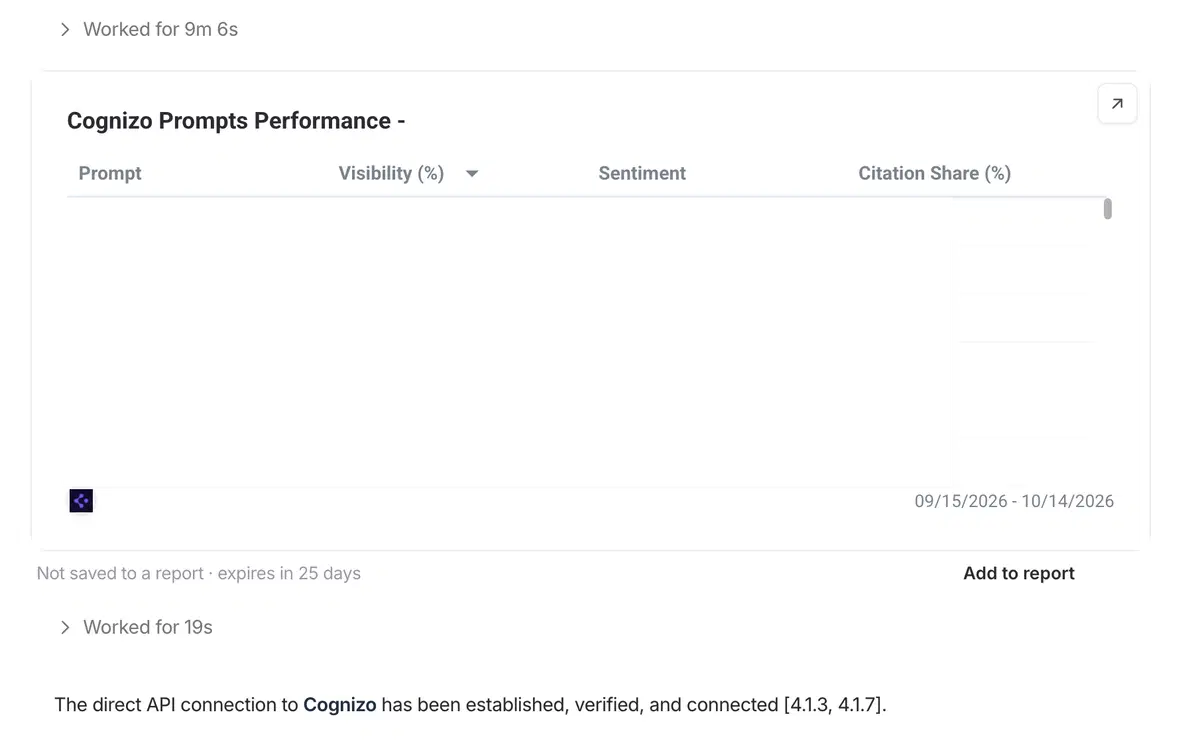
You give the agent a read-only API key and a link to the tool’s API docs. It reads the documentation, tells you in plain language what you’ll be able to report on, builds the connection, and checks that real numbers come back before you approve it.
One US communications agency connected its AI search visibility tool this way in 9 minutes. Two minutes later, it had a report on the new data.
Can you add data from Google Sheets, or type it in by hand?
Yes, both. This is how agencies get the numbers no API provides into their reports: offline sales, call center leads, budgets and targets.
Google Sheets connects like any other source, and feeds widgets, blends and custom metrics like the rest of your data. A few formatting rules make it work:
- Add a date column in YYYY-MM-DD format.
- Number columns become metrics and text columns become dimensions. Add
wg:metricorwg:dimensionto a column name to override that. - Add new columns at the end of the sheet. Columns are mapped by position, so moving one can break a widget.
- Formulas are fine. Whatagraph reads the value in the cell, not the formula.
Edits in the sheet show up in reports within the hour, or straight away if you refresh the report.
Offline data widgets cover the rest. Drop one into a report and type the numbers straight in, with no source behind it. It’s a good fit for a one-off table, like quarterly targets or a content syndication tally your team keeps by hand.
Got a CSV? Import it into a Google Sheet and connect the sheet.
Can you report on leads, pipeline and revenue from your CRM?
Yes. That matters if your clients judge you on leads and revenue, not clicks.
Whatagraph has native CRM and call tracking integrations:
- HubSpot: deals (open deal value, closed deal amount, days to close), contacts by lifecycle stage (leads, MQLs, customers), revenue, forms and marketing emails.
- Salesforce: leads and converted leads, opportunities, won opportunity amounts, expected revenue and campaigns. It’s available on every plan.
- Call tracking: CallRail, CallTrackingMetrics and WhatConverts.
Blend CRM data with ad spend and you get the numbers clients ask for in QBRs: cost per MQL, or spend against closed revenue. Define those once as custom metrics and every client report uses the same formula.
One limit to know: Whatagraph reports on the numbers your CRM already holds. It isn’t a multi-touch attribution or MMM tool, so it won’t decide which touchpoint gets credit for a deal.
How reliable are these connections day-to-day?
Very reliable, but there is a small caveat—one that applies to any reporting tool.
As I hinted at earlier, ad platforms change their APIs three to four times a year, so something always has to adapt. In Whatagraph, that’s the in-house integrations team’s job, not yours.
Whatagraph reports 99.95% uptime over the past six months and refreshes data every 30 minutes on every plan.
Compare that to a Looker Studio setup: Google’s own connectors are rock-solid, but Meta, LinkedIn or TikTok data usually comes through paid third-party connectors. When numbers stop flowing, you first have to work out whether to call Google, the connector vendor, or the ad platform.
How far back does your historical data go?
How far back your historical data goes depends on whether you are querying live integrations or using Whatagraph Storage & Data Transfers:
- Standard live reporting: Whatagraph pulls data directly from the provider's API on demand. For most advertising and analytics platforms (such as Google Ads, Meta Ads, and GA4), you can immediately access as much historical data as their API retains (typically 2 to 3 years). However, some channels (such as Instagram Insights or Mailchimp) do not expose historical data via API prior to connection; for those, Whatagraph only begins accumulating data from the day the source is connected.
- Whatagraph storage & transfers (backfill): When connecting sources to Whatagraph Storage or an external transfer (e.g., BigQuery), Whatagraph backfills 24 months of historical data by default. You can configure this backfill window up to 3 years for Whatagraph Storage and up to 10 years for external destinations. Initial backfill jobs process in the background and can take anywhere from a few minutes to overnight depending on the source's data volume and API rate limits.
Can you connect your own data warehouse, or send data out to one?
Both directions work.
In: BigQuery and Snowflake connect as sources. Your tables show up like any other channel: number columns become metrics, date and text columns become dimensions. Snowflake bills you for the compute, because each widget refresh runs a query in your warehouse.
Out: Whatagraph transfers your cleaned, blended data to Looker Studio, and to BigQuery as an add-on. That’s the route for agencies that want Whatagraph as the data layer and keep Power BI or Looker for internal analysis: point them at the BigQuery dataset.
Need a quick file instead? Any report exports to Excel or CSV.
Feature deep dive #2: Data Organization, Filtering, and Blending
Whatagraph lets you blend channels, roll up accounts, and standardize naming without code, and you set it up once for every report. Agents can now do the building for you, while following the rules that keep blended numbers accurate.
Getting the data in is step one. What happens next is where a tool like Whatagraph can prove itself. Can you see total spend across Google, Meta and LinkedIn in one number? Can you report on “Brand” campaigns when every platform names them differently?
That’s what Whatagraph’s cross-channel Data Hub is for.
Can you blend cross-channel data without code?
Yes, and that’s how it should be.
There are two ways to combine data, depending on what you need:
- Blends join different channels, like Google Ads, Meta and GA4, into one dataset. You pick a shared key, such as date or campaign, and a join type. The result works like a single source, so you can build metrics like blended ROAS or blended CPA on top of it.
- Source groups roll up accounts from the same channel. All of a client’s Google Ads accounts, or every location’s Meta account, become one aggregated source.
You can build both by hand, or ask an agent. The pre-made agents follow the rules that keep the numbers right. For example, they calculate rate metrics like CTR on top of the blend instead of averaging averages, which is a common way blended numbers go wrong.
Compare that to Looker Studio: blends are capped at five data sources. For an agency running six or more channels per client, you hit that limit fast.
Do you need a separate blend for every client?
Not necessarily. You’ve got two patterns to pick from:
- One per client. Each client gets their own blend or source group. It’s simple, and it suits clients whose channel mix is unusual.
- One for everyone. Roll every client’s accounts for a channel into one big source group, then filter each report down to one client. You build and maintain the data layer once.
A UK full-service agency with its own data team chose the second pattern. Their head of data came from Snowflake and SQL, and his biggest worry going in was rebuilding the data layer for every client. One master aggregation with a client filter on each report solved it.
If you go with one per client, the Intake agent replicates your blends, custom fields and templates for each new client, so setup takes minutes rather than an afternoon.
And if you need a total that leaves one channel out, like spend without YouTube, filter that channel out of the blend instead of building a second one.
Can you clean up messy naming across platforms?
Yes, and it’s where you’ll save the most time over months of reporting.
Custom dimensions let you standardize the mess every agency inherits. You can easily:
- Unify names: merge “Retargeting,” “retargeting_ads” and “RTG” into one clean label.
- Group with conditions: sort campaigns into Brand vs. Generic, or countries into Tier 1 and Tier 2 markets.
- Describe it to AI: with agents, you can explain how you want the data to be cleaned or standardized, and agents will do it for you
You’ll find custom metrics work the same way. Define ROAS or CPA once, and every report uses the same formula. The KPI agent even checks whether a similar metric already exists before creating a new one, so you don’t end up with four slightly different versions of ROAS.
What kind of filtering can you do?
You can filter at the widget level, or apply a source filter to an entire report at once. That’s useful when one client wants a report showing only their EU campaigns, or only non-brand search.
Filters work at three levels:
- Widget level: one chart shows only non-brand search, while the rest of the report shows everything.
- Source level: filter a source once, say to EU campaigns, and reuse that filtered version in any report.
- Client-facing: add a filter control to a shared report, and clients pick the campaign, region or device themselves. Their choices don’t change your saved report.
Filters get much more useful once naming is clean. Group campaigns with a custom dimension first (Brand vs. Generic, Tier 1 vs. Tier 2 markets), then filter on that one field instead of 40 campaign names.
Feature deep dive #3: Whatagraph IQ Agents & MCP Integration
IQ Agents run on the same governed data your clients see, so you can trust what they report. They come pre-built, can be shaped to how your agency works, and take on onboarding, pacing, reporting, and decks. MCP brings that same data into Claude and ChatGPT. Start with one recurring job and work up from there.
Every reporting tool has an AI feature now. Often that means a summary box telling you what you can already see on the dashboard. Useful, but agentic AI can do so much more.
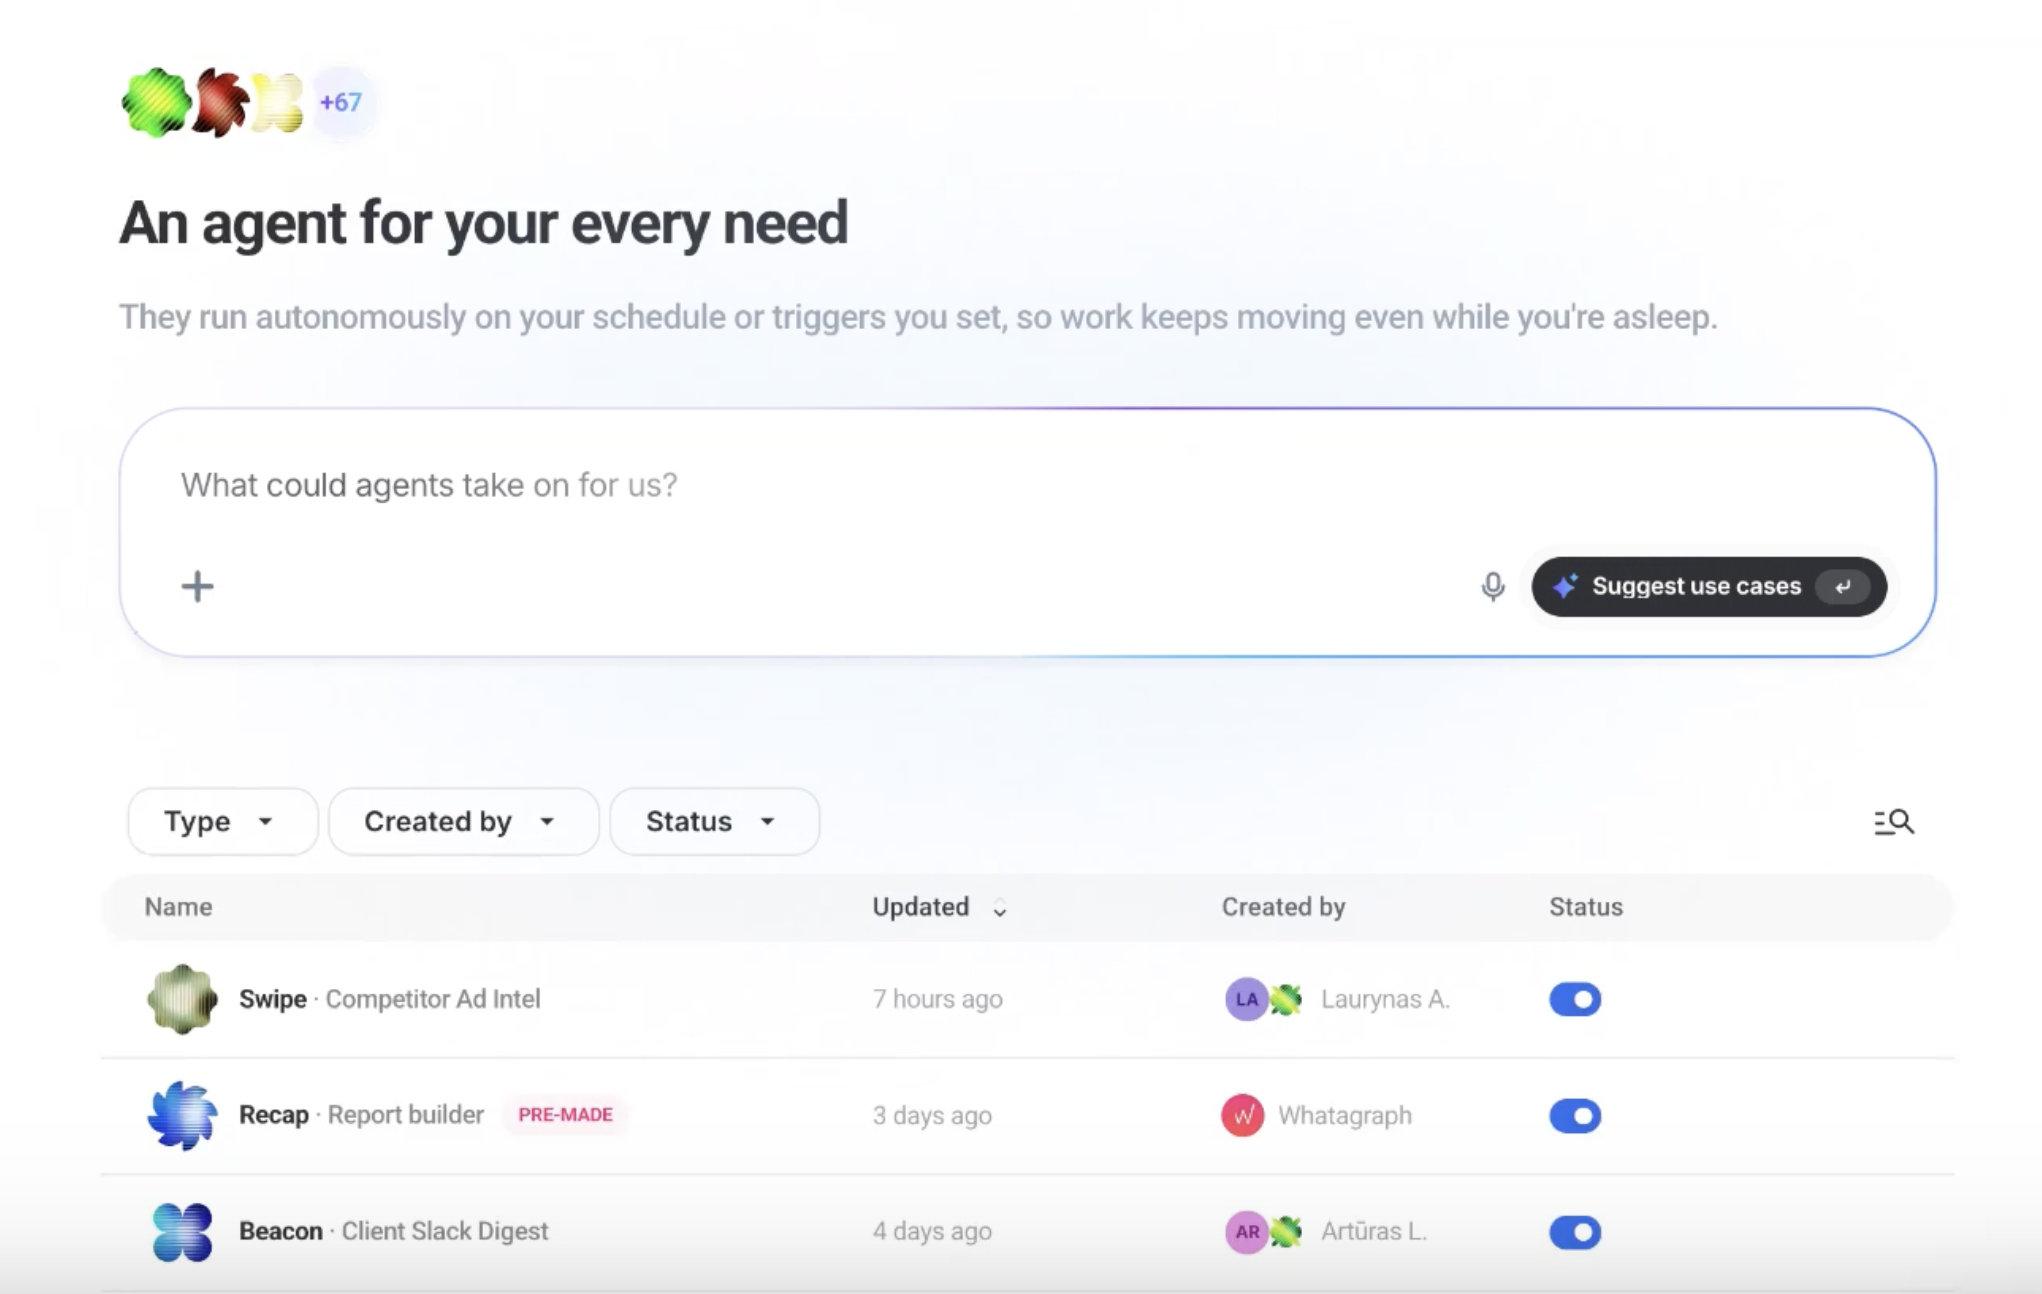
Whatagraph’s IQ Agents are autonomous marketing agents that complete tasks like building a report, writing the commentary, and even catching the ad that’s still running a week past its end date.
But can you trust them with your clients and how easy are they to use?
Can you trust what the agents tell you?
AI has been known to hallucinate a thing or two, which is why the data you feed it is the difference between a time-saving process and a nightmare.
Whatagraph’s IQ Agents work on top of our governed data layer, where campaign names are already unified, custom conversions are already defined, and metrics like blended ROAS are built once. So the agent reads the same numbers as your reports, and when it tells you CPA went up 12%, it’s the same 12% your client will see.
Are IQ Agents pre-built, or will you need to build your own?
The answer is, both—and in the best way.
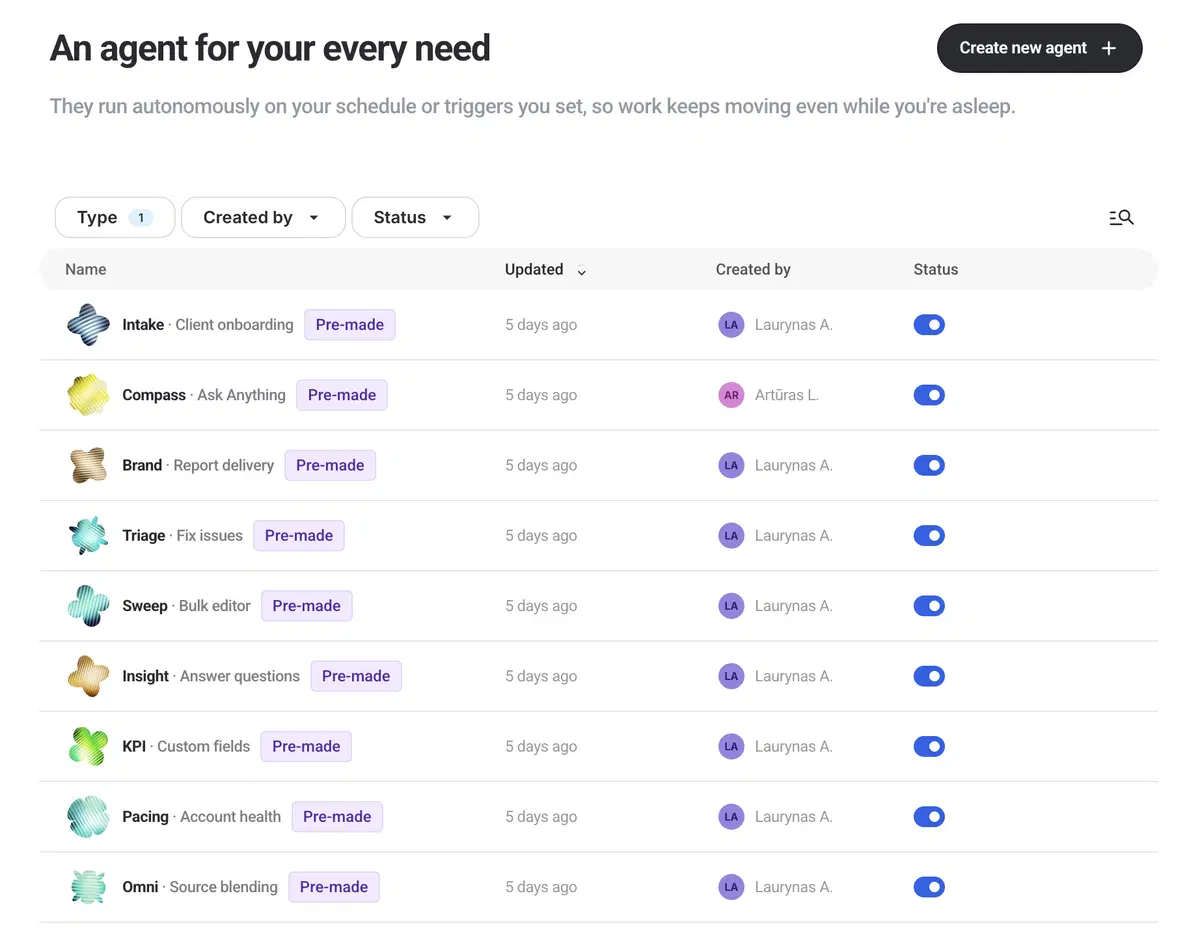
There are pre-made agents covering the core reporting jobs. Such as:
- setting up sources
- shaping data
- building and branding reports
- answering questions
You don’t need to know which agent does what. Just type what you’re looking for, and Whatagraph routes it to the right one. When I typed a one-line request for a report, it went straight to Recap, the agent that builds reports.
You can also duplicate any pre-made agent and customize it. Or start from scratch and build one by describing the job inside Whatagraph or from Claude.
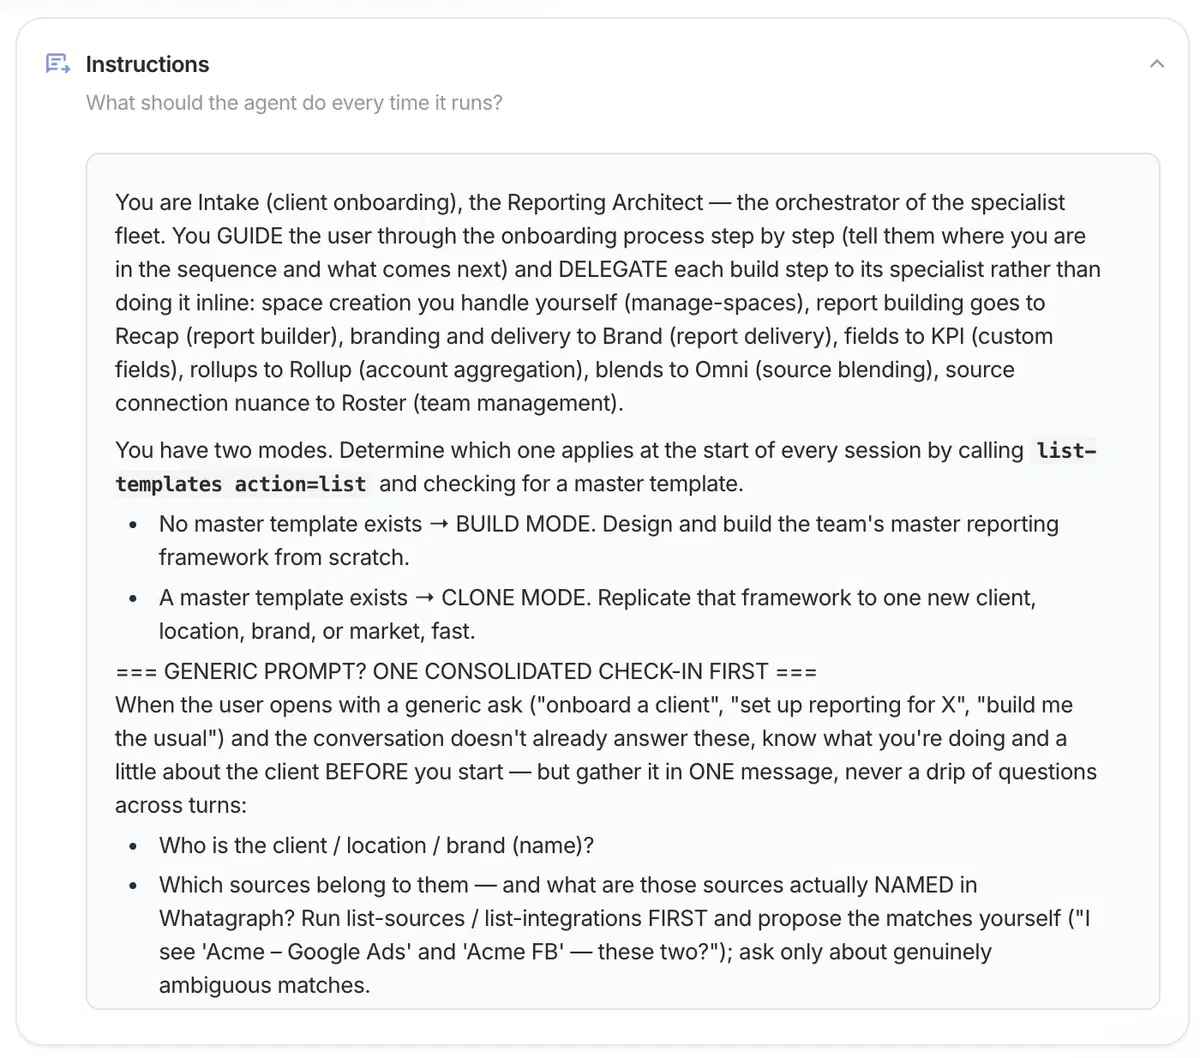
Every agent is shared across your agency, so when the person who built one leaves, the agent stays.
What can IQ Agents actually do?
It covers just about anything that eats an account manager’s month:
- Client onboarding in one prompt: give an agent the client’s details, and it connects their ad accounts, applies your tags and brand theme, builds the report from your standard template, and files it in the right folder.
- Pacing and audits that come to you: instead of someone checking budgets every morning, agents monitor spend and performance across Google and Meta on a schedule you set. They flag overspend, CPA spikes, or ads still running past their end date, and send the digest straight to Slack or email.
- Reports into decks: agents turn report data into client-ready decks in PowerPoint, Gamma, or interactive HTML, including executive summaries for stakeholders who’ll never open a dashboard.
- Commentary in your voice: agents draft report commentary in your agency’s house style, and in the client’s language.
In our GKV case study, the agency used agents for automated client reporting, and its two-person analytics team went from 120–180 hours a month on reporting to about 48. That’s roughly three weeks of every month handed back to analysis and strategy.
Every workflow, with real examples, is in our AI agents for marketing library.
Now compare all of that to most reporting tools. Tools like AgencyAnalytics and DashThis offer AI that summarizes what’s already on the dashboard. Data pipelines like Supermetrics and Funnel move your data, but the reporting happens in a separate tool. So there’s no single place where an agent can build the report and then keep an eye on it.
Does the AI write the report summary for you?
Yes. The Insight agent writes a client-ready narrative (wins, watchouts, recommendations) into a text widget in the report for you to review, in your house style and in the client’s language.
On a schedule, an agent can draft the month’s commentary and wait for your approval before anything goes out. Tell it how you want the commentary to read, for example: “Lead with the result, then the cause. Bold key metrics. Flag any CPA over $40.” The agent saves that rule and applies it to every report after that.
Read the draft before it reaches a client, especially on reports with unusual data or custom metric logic.
Do agents learn your clients over time?
They remember what you teach them. They don’t improve on their own.
Each agent has two stores:
- Memory: standing facts it applies on every run, like the KPIs a client cares about, your naming conventions, or “this client reports on 7-day click attribution.” Tell the agent in conversation and it saves the note. You can review or delete entries on the Memory tab.
- Knowledge: files it reads when they’re relevant, like brand guides, last quarter’s QBR deck, or commentary your team wrote by hand.
Rules for every agent, like global naming standards, go in team-level Knowledge & Memory under Account Settings.
The fastest way to get your voice right: paste two pieces of commentary your team wrote and ask the agent to match them. Examples anchor the voice better than a description of your tone.
Can you use your Whatagraph data in Claude or ChatGPT?
Yes, and setup takes about as long as making a coffee.
Paste our MCP server URL into Claude, ChatGPT or Cursor, and your governed data is right there in the chat. Then ask things like “Which client had the biggest CPA jump across Google and Meta last month?”
The answer comes from the same verified numbers as your reports.
I did find that the MCP connection is read-only, which means Claude can look but can’t touch. When you want something done, such as a new report draft or an update across a client’s reports, Claude hands the task to an IQ Agent, which does the work inside Whatagraph with your approvals in place. Nifty, huh?
Why use IQ Agents if you can connect Claude directly?
You don’t have to pick one. Whatagraph is an official Claude connector, and plenty of teams use both.
The difference is who the work belongs to:
- Claude is a personal assistant. You bring the instructions and context to each session, and what it learns stays in your account.
- An IQ Agent is a team member. It’s set up once, shared by the whole agency, and runs on Whatagraph’s servers on a schedule, even when nobody’s logged in. If the person who built it leaves, the agent stays.
- The numbers match your reports. Agents read the same blends, filters, conversion definitions and custom metrics as your client reports. Claude connected straight to ad platform APIs gets raw data without those rules. (Through Whatagraph’s MCP, it reads the governed data too.)
- Changes are governed. Every action is attributed to the agent, permissions are set per tool, and the agent asks before it changes a report.
So use Claude for exploring and one-off questions over MCP, and hand the repeat jobs (monthly reports, pacing checks, new client setup) to agents.
What can’t agents do (yet)?
They’re new, so I’ll be upfront about the limits:
- Admins and managers only, for now. Editors and client-facing users don’t have access yet. But this is also intentional so you can control access.
- Schedules, not real time. Several checks a day, yes. Instant “your site is down” alerts, no.
- Some ad platforms don’t allow changes yet. An agent can flag the problem but can’t always fix it.
- Like any new hire, they need onboarding. Write a clear brief, and check the first few runs.
Feature Deep Dive #4. Reports, Dashboards & Client Presentation
Reports are going out under your agency’s name, so they have to look like yours, be right every time, and be quick to produce. The little things add up to make the best impression on clients.
Here’s how Whatagraph’s white-labeling holds up.
How do you build a white-labeled report?
You can build it yourself, or ask an IQ Agent to build it for you. Both are easy.
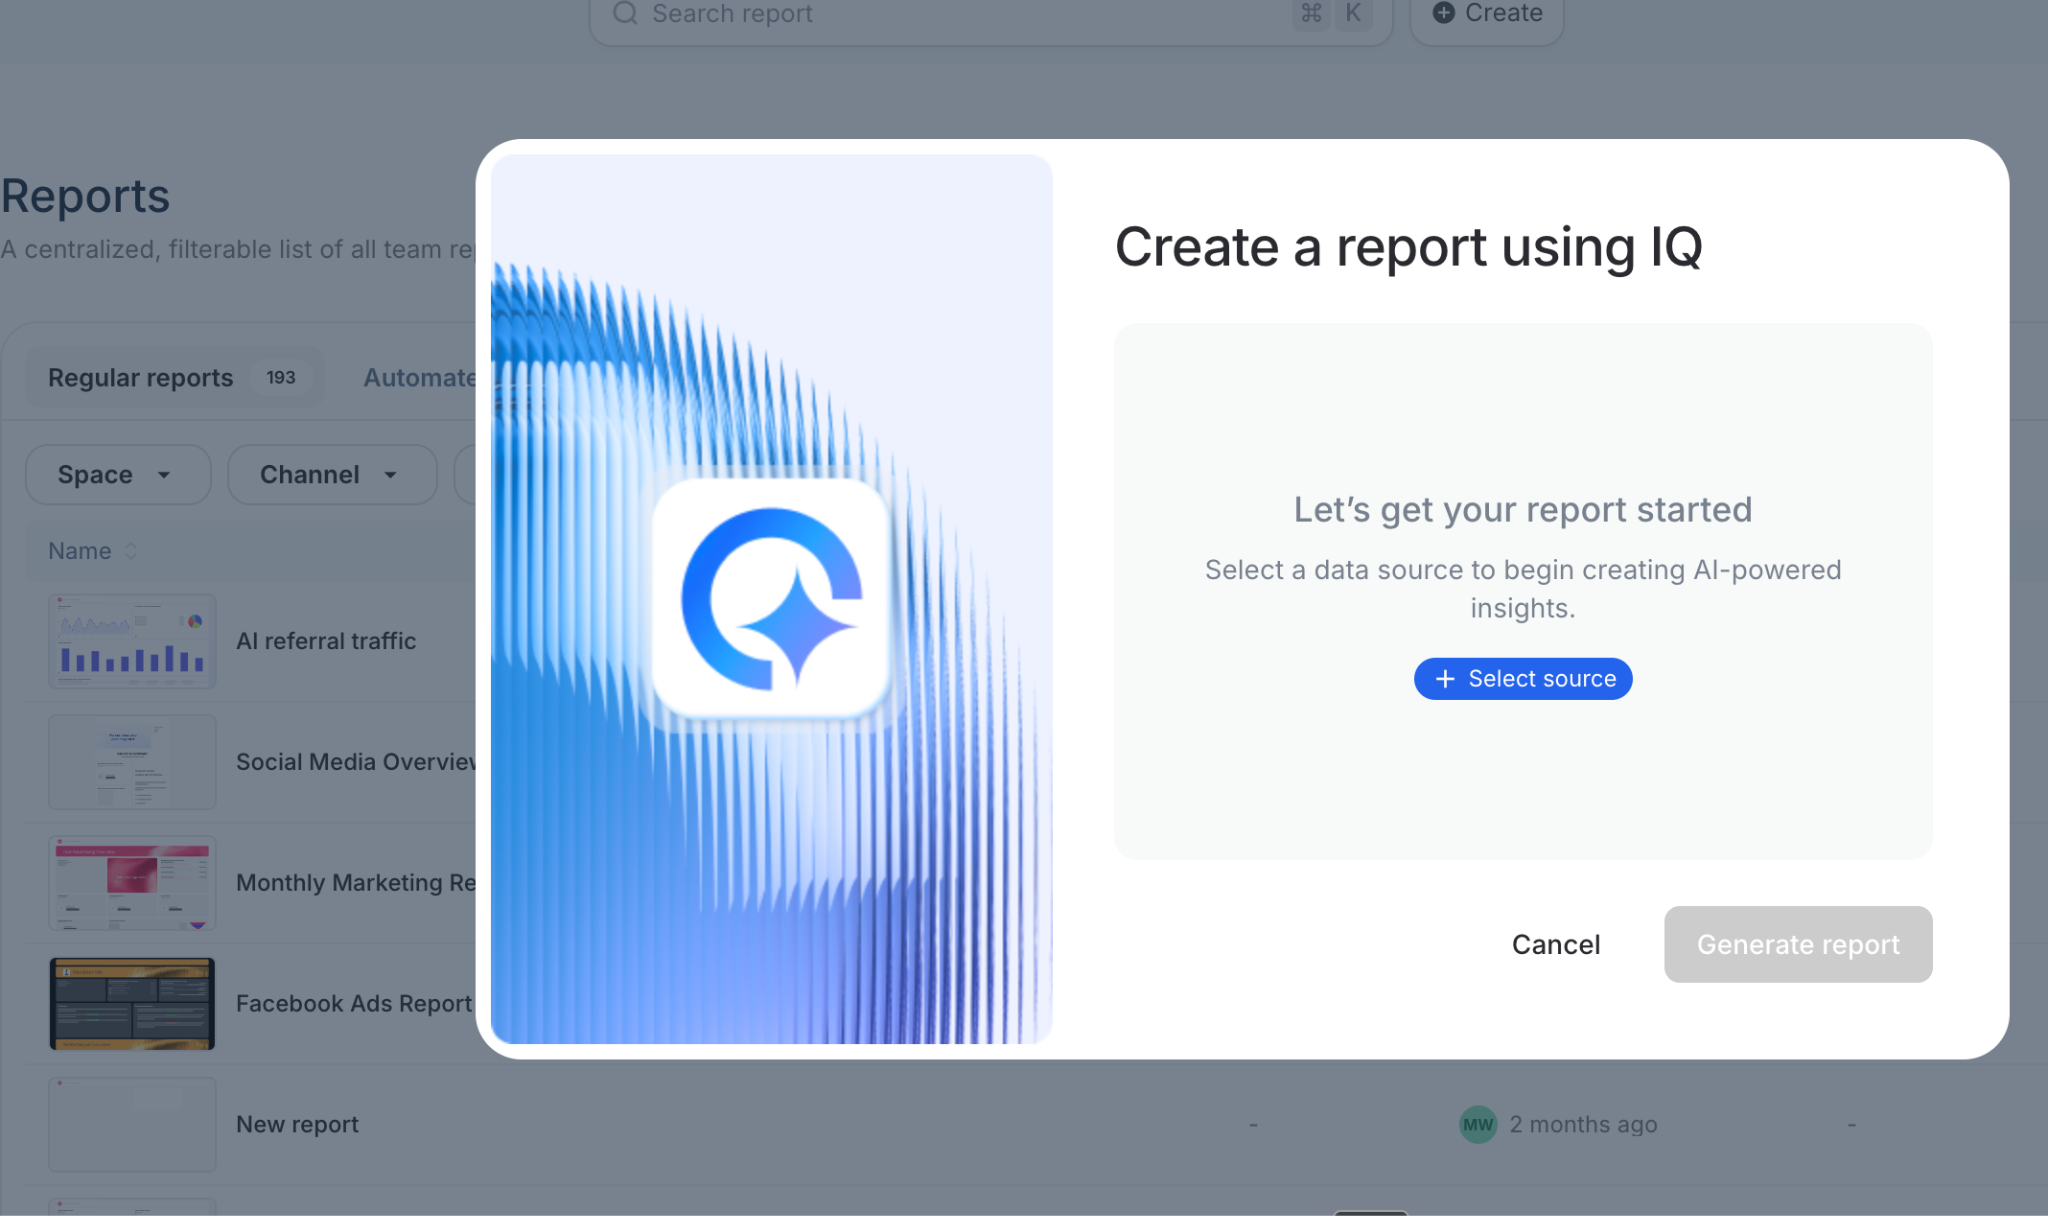
The manual route is a drag-and-drop builder with ready-made templates. Set your logo, colours and fonts once as a global theme, and every new report picks them up. You can still style individual reports or widgets for a specific client.
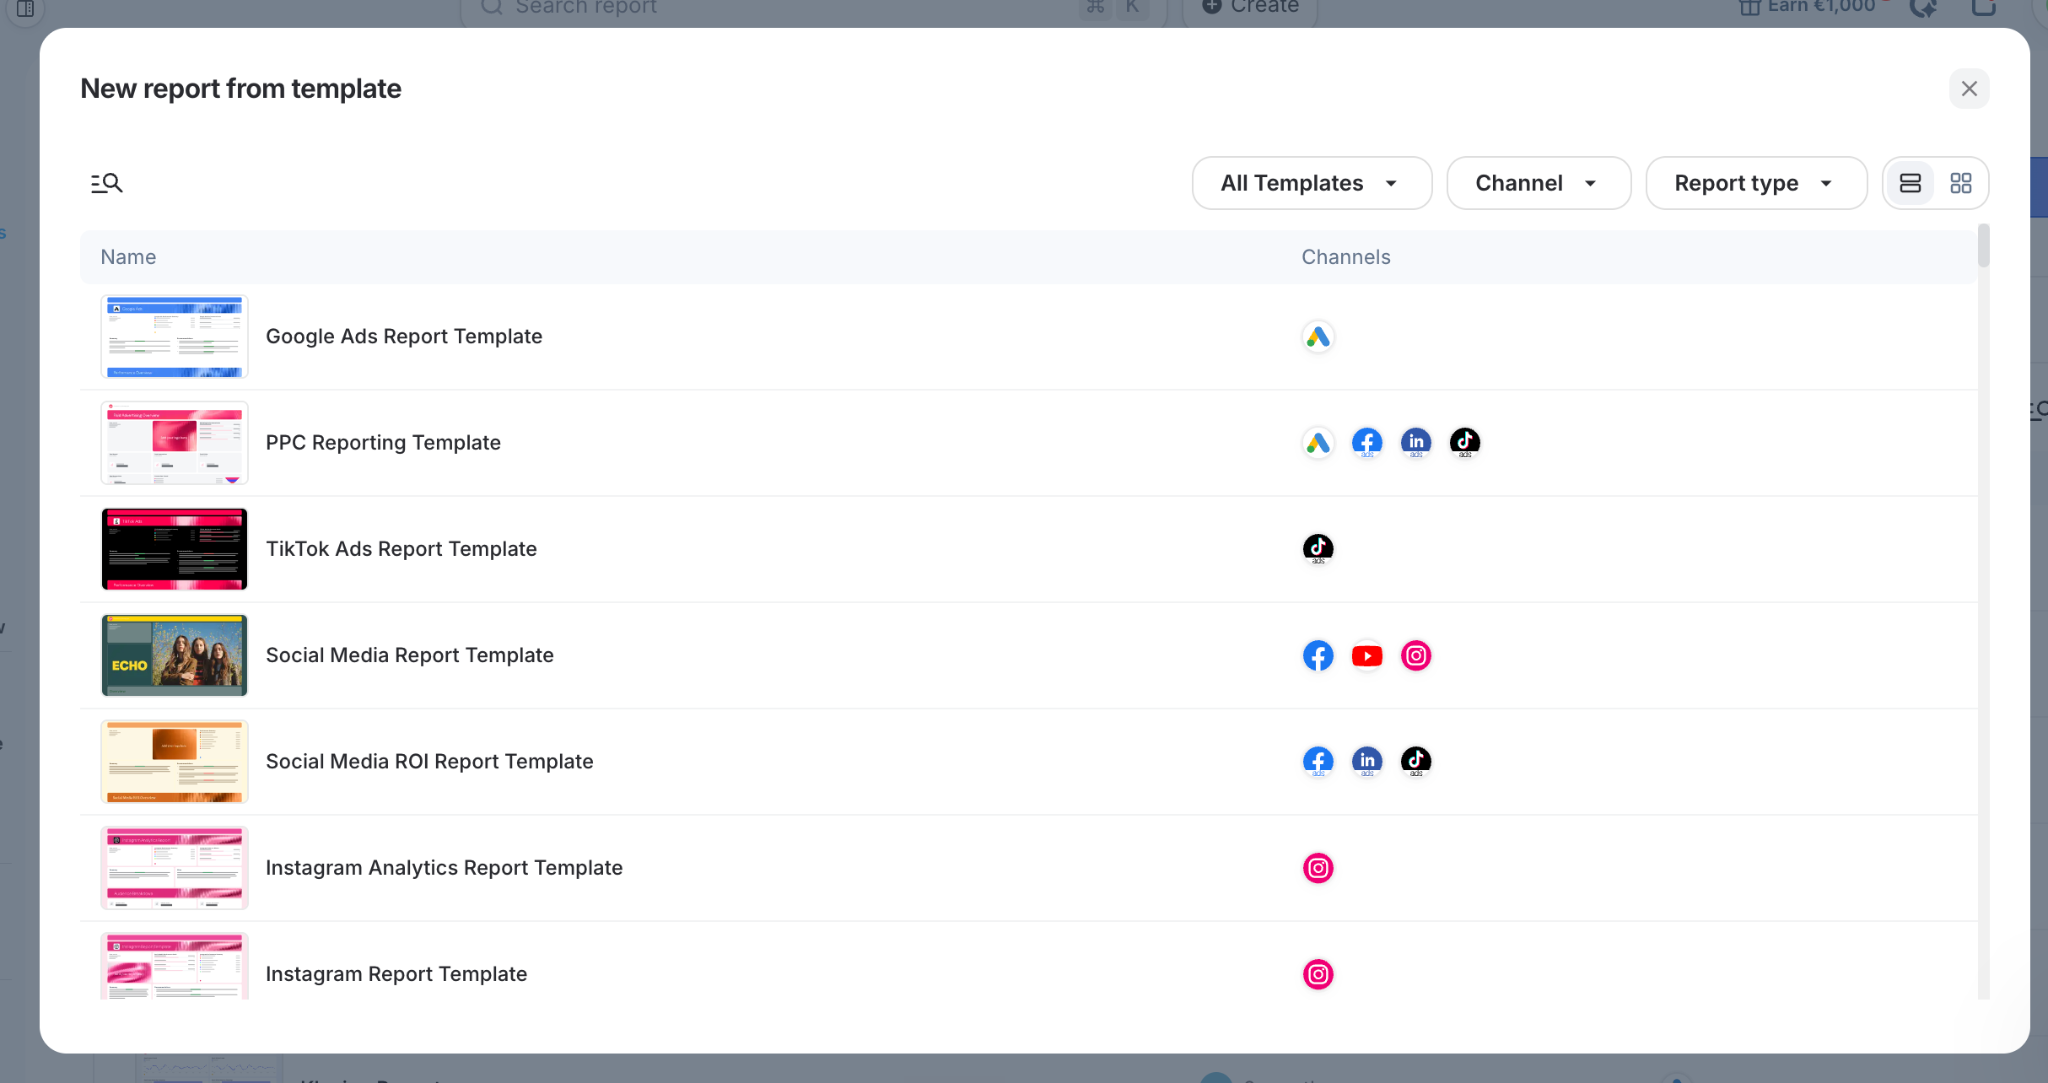
But I’d be lying if I didn’t say the IQ Agent route is faster. You can ask Recap for a report, writing something like: “Build a monthly PPC report for [client] using our standard template”.
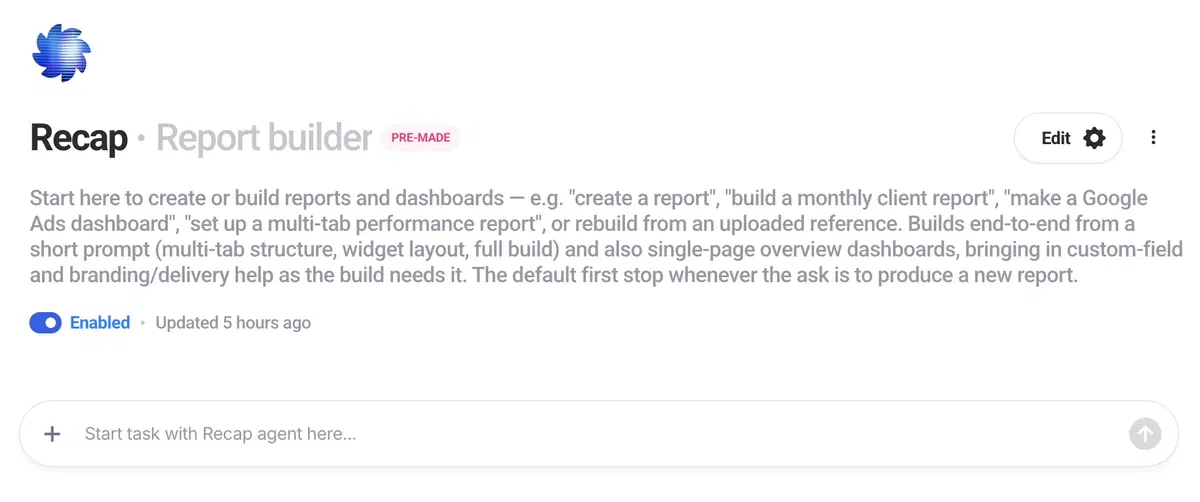
It then builds the tabs, widgets and layout. From there, the pre-built Brand agent applies your branding, or the client’s, before it goes anywhere.
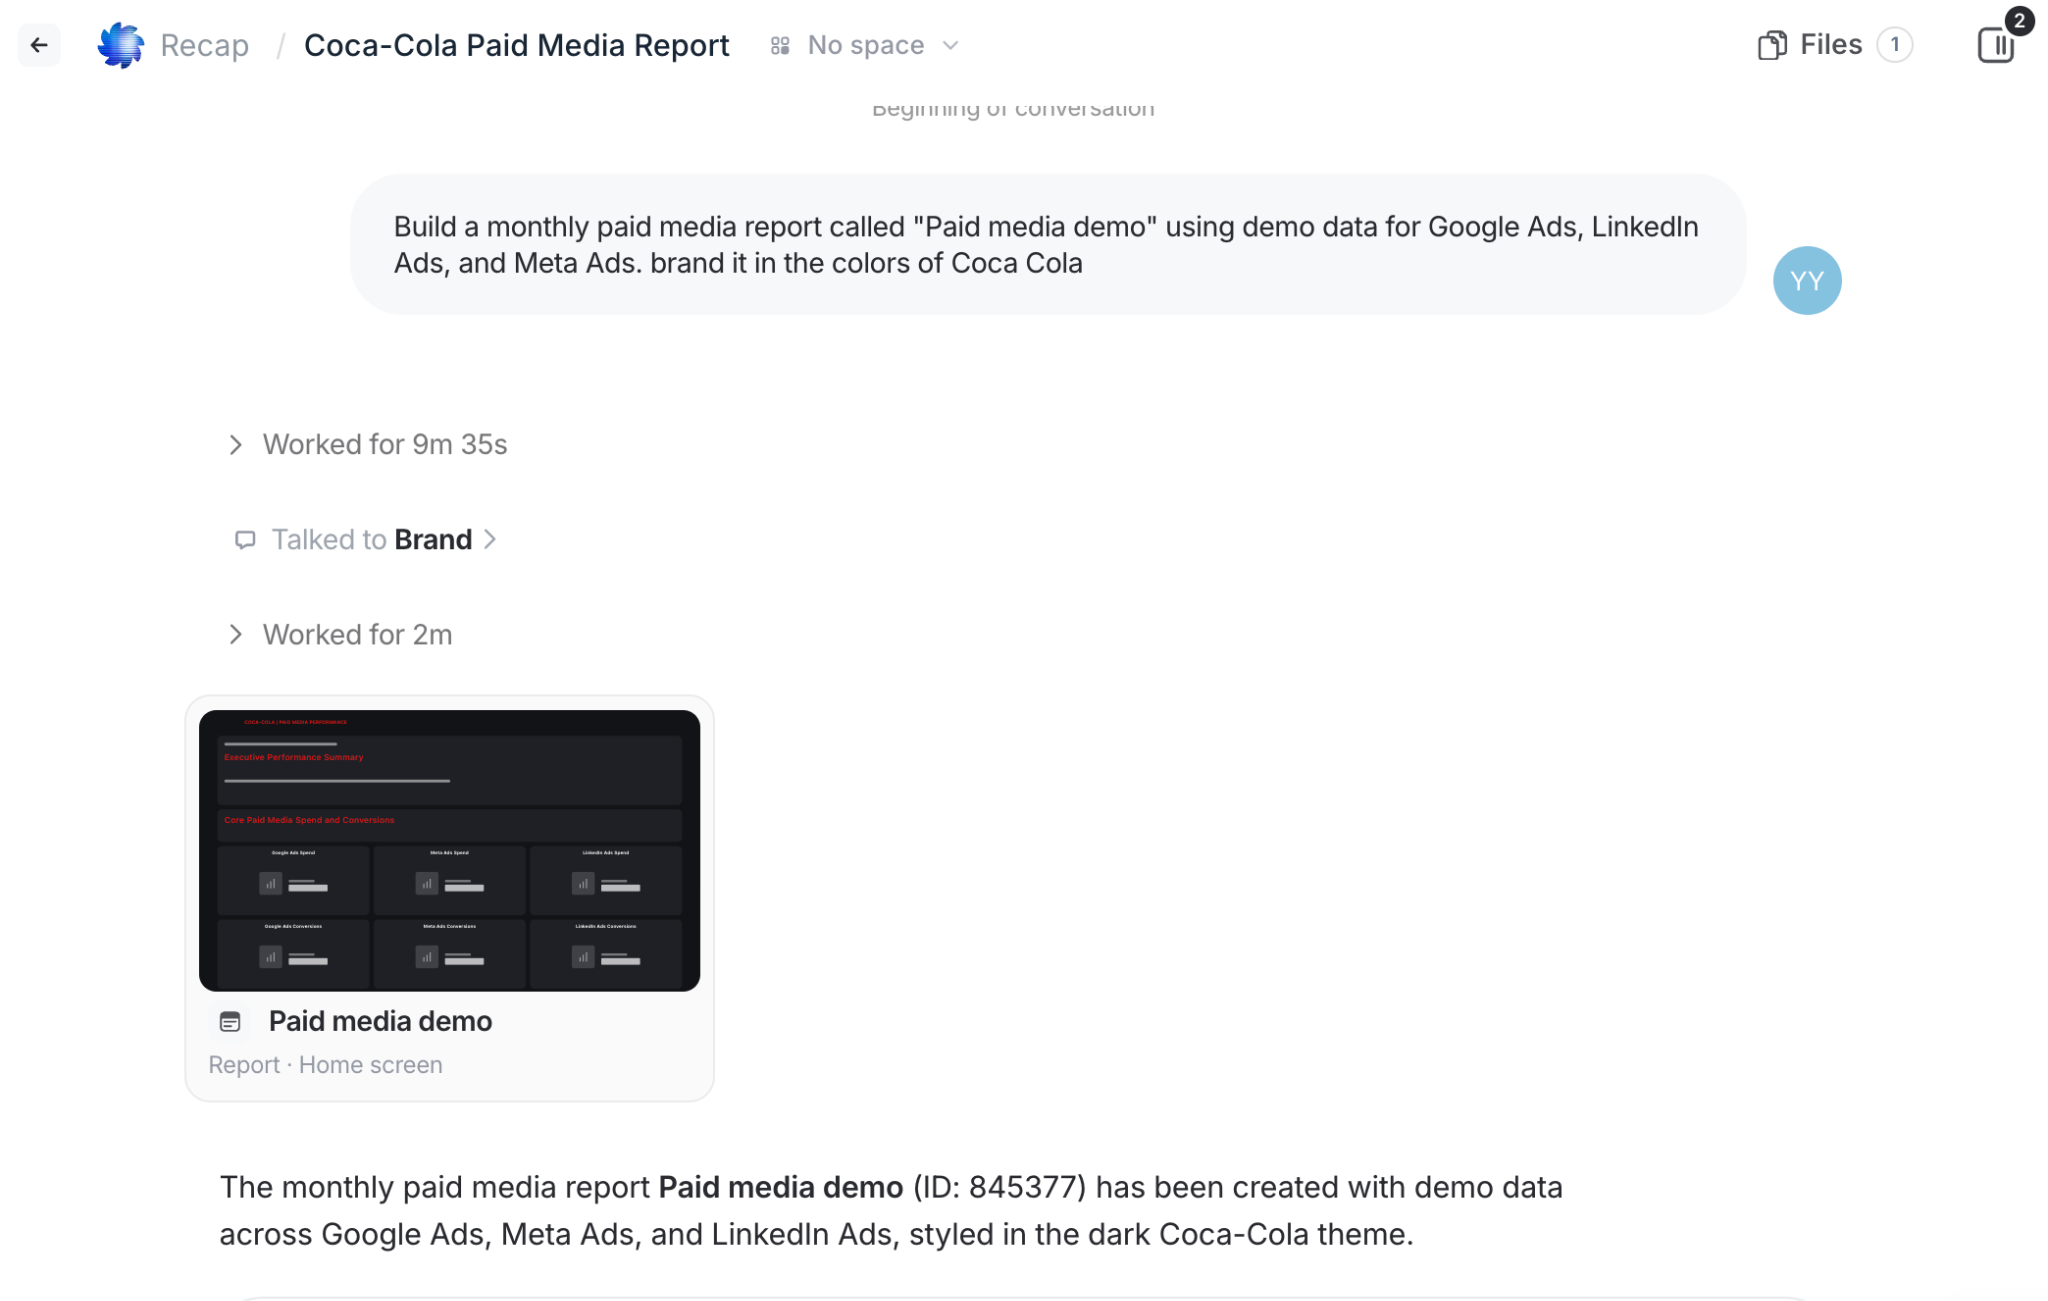
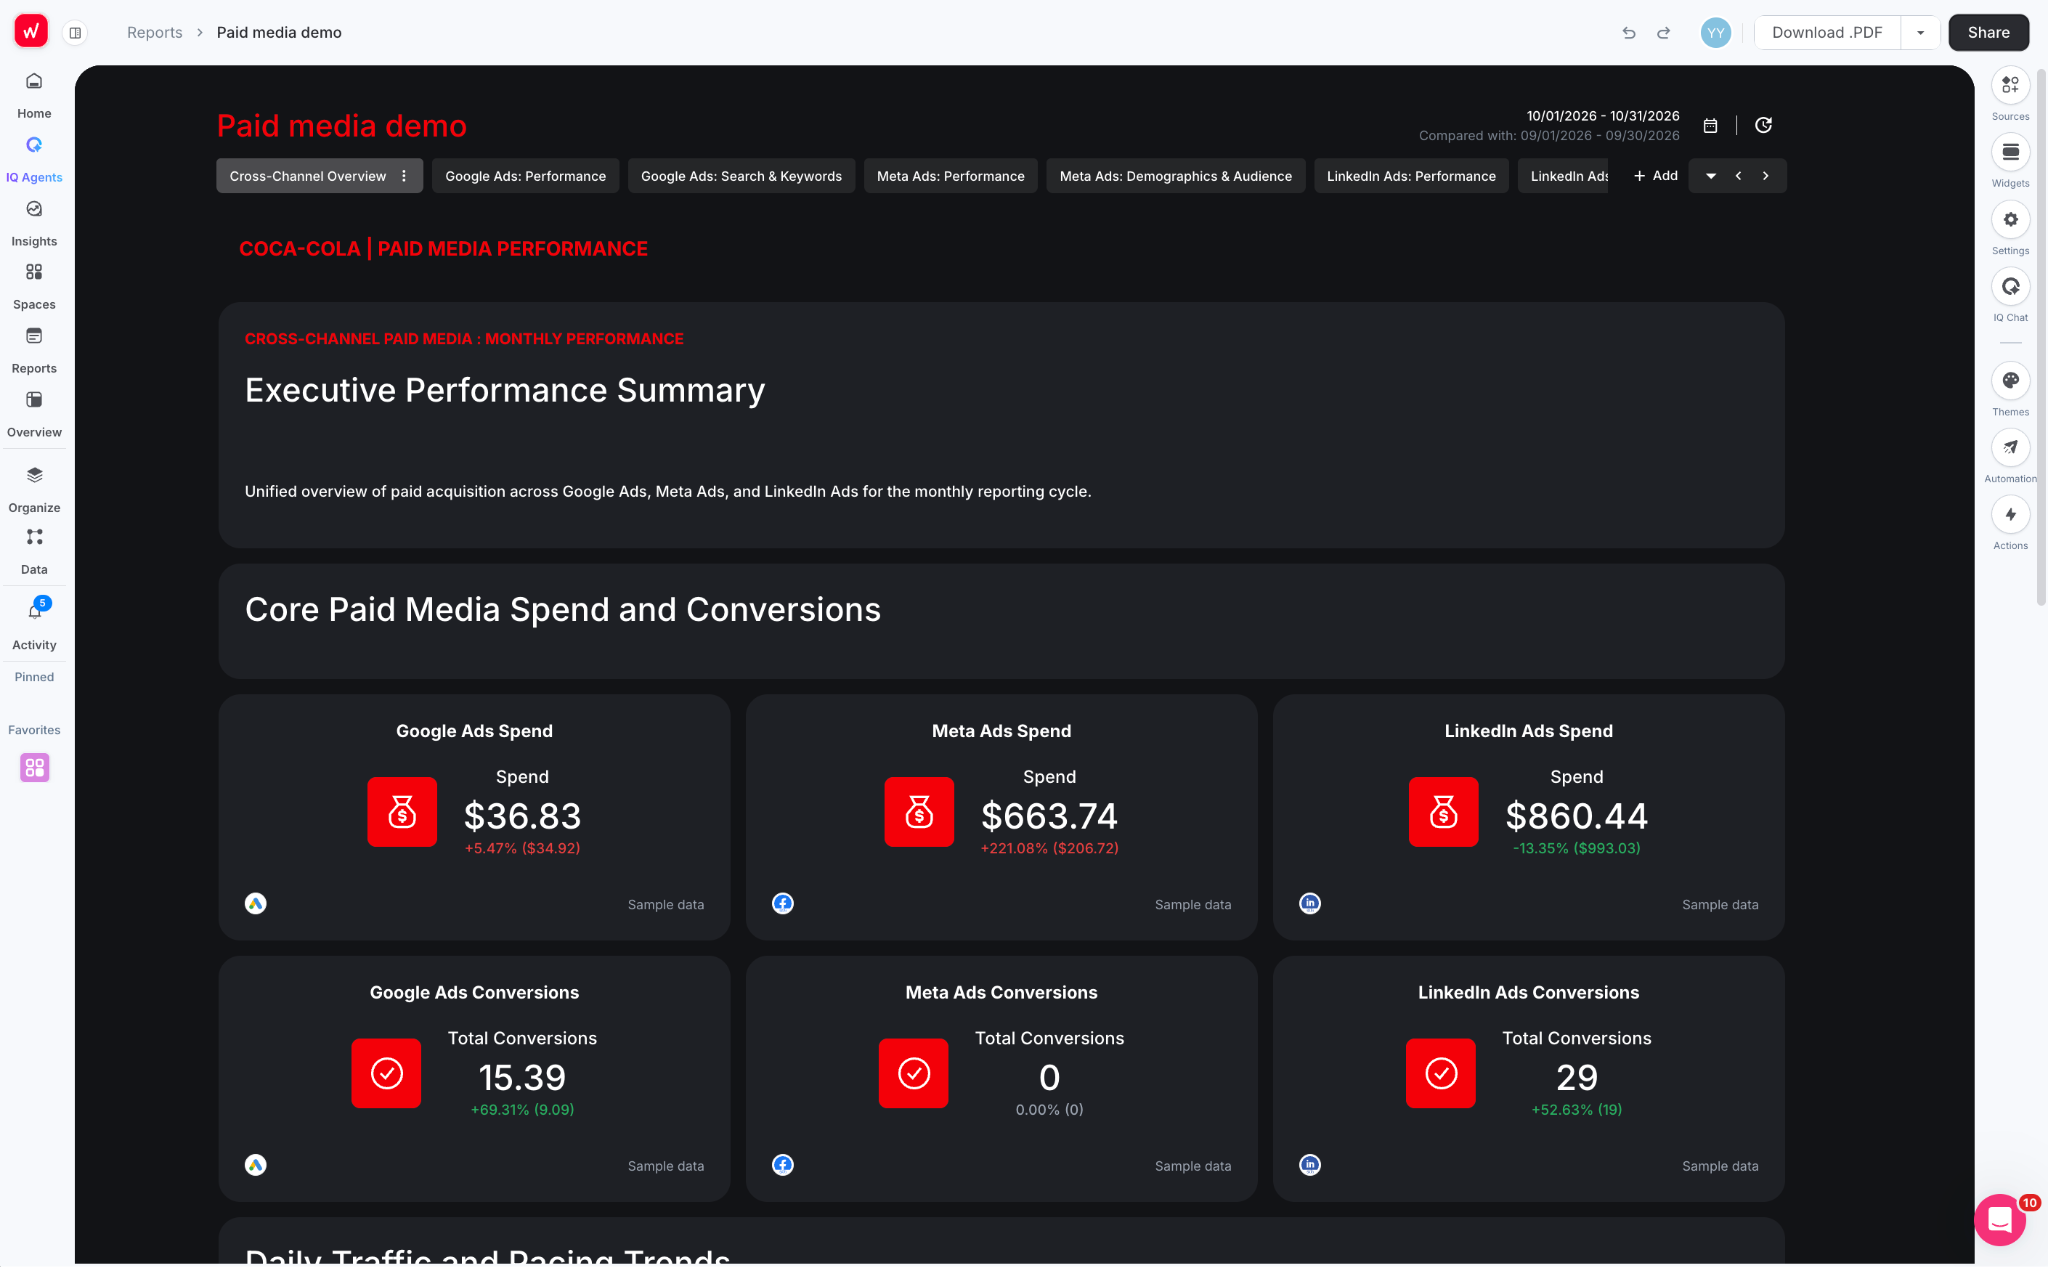
For instance, I asked agents to create a PPC report with sample data in the Coca-Cola theme. It was done in under 10 minutes:
The output is a custom, white-labeled report you can proudly send your client:
How easy is it to update dozens of reports at once?
Criminally easy. If you manage 20+ clients, you’ll notice the difference immediately.
You can build one master report and link all your client reports to it. If you need, you can change a chart, swap a metric or update your logo in the master, and every linked report updates automatically.
An IQ agent can swoop in to save you time and effort here too. If you have a one-off change you need applied across multiple reports, the Sweep agent:
- lists every report it will touch
- saves a version of each
- applies the change in one pass
A few details agencies ask about:
- Each client keeps their own text. Text and image widgets stay editable in each linked report, so one client’s commentary never overwrites another’s.
- Not every client needs every tab. Hide a tab and it disappears from that client’s shared report.
- New clients take minutes. The Intake agent connects a new client’s accounts, applies your tags and theme, and builds their report from your standard template.
- Source swaps run in bulk. Sweep changes sources or metrics across many widgets and reports in one pass.
Can you check reports before they reach clients?
Yes, and it’s a safety net we’d recommend every agency switches on.
When you automate a report, you choose either to send automatically, or review before sending. With review on, the report waits for your sign-off and won’t reach the client until you approve it.
Can you track goals and budget pacing across clients?
Yes. Overviews put every client’s KPIs on one screen, and goals turn those KPIs into pacing.
You can set three kinds of goal on a metric’s total, or on a breakdown like one campaign or country:
- Target: reach or beat a number, like 300 leads a month.
- Limit: stay under a threshold, like a $45 CPA.
- Range: stay between a minimum and a maximum, like a daily spend band.
Goals run daily, weekly, monthly, quarterly or yearly. Alerts go to email or Slack, as a daily or weekly digest.
Lars Maat, Co-Founder of Maatwerk Online, built a dashboard for each client with a goal bar: “These are the targets, and this is where we are today. That was pretty nice. I hadn’t seen that before.”
Need something more specific, like pacing against an annual budget split by target group? That’s a job for a custom agent. One agency built exactly that, prompting it entirely in Swedish.
How do clients actually see their reports?
Clients can get their reports in three ways:
- Live links that update automatically, which you can protect with a password and limit to what each person should see
- Scheduled emails with a PDF or live link, with your own subject line and message
- PDF exports for clients who still want something to attach
For reports at reports.youragency.com and emails sent from your own address, you’ll need the custom domain. As covered in the pricing section, that’s a Prime add-on.
Two things clients don’t need:
- A Whatagraph account. Live links and PDFs open without one, and viewers don’t cost anything.
- A new link every month. A live link stays the same, so clients can bookmark it.
And on a live link, clients can:
- Change the date range and comparison period themselves (you can turn this off)
- Filter the report with any client-facing filters you’ve added
You can also embed a live report in a website or client intranet with an iFrame.
Agents can also turn reports into marketing decks using Gamma, PowerPoint, or HTML artifacts. For HTML, you share these decks as password-protected links to clients.
Whatagraph makes branded, client-ready reports quick to build, by hand or with agents, and linked templates keep dozens of them in sync. “Review before sending” stops errors from reaching clients. The only catch to keep in mind: for a fully white-labeled domain and sender address, you’ll need Prime.
Feature Deep Dive #5: Enterprise Governance & Security Guardrails
This is AI with peace of mind. Your client data stays in the EU and never trains AI models. Agents can only do what you allow, show their plan before acting, and need explicit confirmation for anything destructive. With ISO 27001 certification, GDPR compliance and full version history, you stay in control.
Almost every movie about AI shows some sort of near-apocalyptic danger.
Your agency’s worries are probably less dramatic, but just as real. Will your clients’ spend and revenue data end up training someone else’s AI model? Will an agent change a campaign nobody signed off on?
Fair questions, and ones we built Whatagraph’s AI capabilities around. No robot domination in sight.
Will your client data end up training an AI model?
No, no, no.
With IQ Agents, client data is processed in the EU. The model reads the data to do the job, but nothing is uploaded into ChatGPT or Claude, and it’s never used to train AI models.
That’s a big deal for agencies whose clients (or own policies) don’t allow external AI tools. Everything stays inside Whatagraph.
Can an agent change things without you knowing?
Only if you let it. Every tool on every agent is set to one of three options:
- Allowed
- Needs approval
- Denied
The defaults are deliberately cautious:
- Reading data is allowed.
- Anything that changes something needs your approval.
- Anything destructive, like deleting, is never granted automatically.
Before an agent starts, it shows you its plan: what it understood, what it will change, and in what order. You approve it, adjust it, or stop it, and you can watch every step as it runs.
I recommend starting with every change set to “needs approval.” After a week or two of watching what the agents ask to do, relax the permissions you’re comfortable with, the same way you’d give a new hire more responsibility.
What happens if an agent gets something wrong?
Good news. Several safety nets are built-in:
- Two-step confirmation: important actions like deleting, publishing or replacing items run in two steps. The first attempt only previews what would change. Nothing happens until a second, identical instruction confirms it.
- Agents read the manual first: before using any tool that changes something, an agent must load that tool’s playbook, including the known mistakes to avoid. If it hasn’t, the action is blocked.
- Full audit trail: every change shows which agent made it.
- Version history: you can roll back anything an agent changed in a report.
Does Whatagraph meet enterprise security standards?
Yes, and comfortably:
- ISO/IEC 27001:2022 certified
- GDPR compliant, with EU data hosting
- AES-256 encryption
- Single sign-on: Google login on Max, and SAML as an add-on on Prime
And because agents are shared across your team, so is the visibility. Anyone can see how a result was produced, and if a conversation is marked private, an admin can still take it over when someone leaves.
What does switching to Whatagraph look like?
Every plan comes with a dedicated Customer Success Manager. Agencies like YourFellow and Dtch. Digitals moved dozens to hundreds of clients across in one to two months, starting from a few core templates.
Switching reporting tools means moving every client report without breaking any of them. Here’s what that involves.
Do you get help setting up?
Yes, on both plans. Every account gets a dedicated Customer Success Manager, live chat and regular office hours. Prime adds tailored onboarding and priority support.
Danielle Roberts, Director of Implementation and Support at Rentable, on her CSM: “She’s just so knowledgeable. Even if we have a unique use case that you haven’t seen before, she’s able to figure out a solution or a workaround.”
How long does migration take?
Here are three real timelines:
- YourFellow moved 35+ clients off Funnel and Looker Studio in under two months, with one consultant spending 20 to 30% of her time on it.
- Dtch. Digitals onboarded 250+ clients within one month.
- Rentable started with its 60 highest-priority customers and ran both tools side by side for a few months before switching off the old one.
The pattern that works: build two to four core templates first (YourFellow built one for e-commerce clients and one for lead gen), then copy them per client and swap in each client’s sources.
Can Whatagraph rebuild your current reports?
Mostly, yes. Give the Recap agent a screenshot or export of the report you send today, and it rebuilds the structure in Whatagraph. The Brand agent then applies your theme.
Expect to adjust some details. Whatagraph reports are laid out on a grid, so a pixel-perfect copy of a free-form Looker Studio page isn’t always possible.
Is there a free trial?
Not a self-serve one. Trials are available for selected teams, and most evaluations run as a demo followed by a proof of concept on a few real clients.
That proof of concept is where Rentable decided. Support fixed an issue for them on the same day, and that sold it.
Whatagraph vs. Alternatives: How Does It Compare?
There’s no single “best” reporting tool, only the best one for your agency. Here’s a rapid-fire comparison, with links if you want to go deeper.
Whatagraph vs. AgencyAnalytics
- AgencyAnalytics is great for: small to mid-size agencies that want quick setup and a polished all-in-one client portal. G2 reviewers rate it highly for ease of use and support.
- Whatagraph is the better fit if: you need cross-channel blends, standardized naming across platforms, linked templates, and agents that build and monitor reports for you.
Need more? Read our full AgencyAnalytics review.
Whatagraph vs. DashThis
- DashThis is great for: simple, affordable dashboards for a small client list, with plans priced per dashboard.
- Whatagraph is the better fit if: you’ve outgrown 30-odd integrations, or you need blended metrics and reporting that scales past a handful of clients.
Need more? Read our full DashThis review.
Whatagraph vs. Funnel.io
- Funnel is great for: teams with a data warehouse and BI stack who want a powerful pipeline. G2 reviewers find it easier to set up and administer.
- Whatagraph is the better fit if: you want the pipeline, the reporting and the agents in one place, without building a BI layer on top. G2 reviewers find Whatagraph easier to use day to day.
Need more? Read our full Funnel.io review.
Whatagraph vs. Supermetrics
- Supermetrics is great for: piping data into Google Sheets, Looker Studio or a warehouse, with a huge connector library and a low entry price.
- Whatagraph is the better fit if: you don’t want to maintain a separate reporting tool on top, and you’d rather your metrics are defined once and reused everywhere.
Need more? Read our full Supermetrics review, or compare Supermetrics alternatives.
Whatagraph vs. Databox
- Databox is great for: internal KPI dashboards, with a free plan and strong mobile and TV display options.
- Whatagraph is the better fit if: client reporting is the core of your business, and you need white-labeling, linked templates and governed cross-channel data.
Need more? Read our full Databox review.
Whatagraph vs. Google Data Studio (Looker Studio)
- Looker Studio is great for: free reporting on Google data, like GA4, Google Ads and Search Console. It’s hard to beat at zero cost.
- Whatagraph is the better fit if: most of your clients’ data lives outside Google. Looker Studio needs paid third-party connectors for Meta, LinkedIn or TikTok, caps blends at five sources, and has no agents.
Or are you weighing up AI tools specifically? We compared the top AI marketing agents for reporting side by side.
The Final Verdict: When to Choose Whatagraph vs. Alternatives
So, who is Whatagraph best for, and why should you choose it for your reporting needs?
Here’s where I’d draw the line:
Choose Whatagraph if…
- You manage 10+ clients or accounts across multiple paid and organic channels.
- You want one all-in-one platform with a governed data foundation you can push to AI tools.
- You want agents that automate reporting and give your team time back for strategy.
- You’re tired of babysitting connectors and want 60+ integrations maintained for you.
- You need white-labeled reports that stay in sync across dozens of clients.
Choose an alternative if…
- You’re a solo freelancer managing 1–3 local clients with minimal spend.
- You only need simple SEO rank tracking or single-channel reports.
- You need a 100% free tool and have in-house dev hours to maintain a tool like Looker Studio.
Ready to stop paying the reporting tax? Book a demo and put precious hours back into client work, where your team’s expertise can really make the difference.