


What Should a SEM Report Template Include?
Based on how marketers actually build SEM reports in Whatagraph, below are the sections, metrics, and visualizations we recommend including—and how we structured our SEM report template.
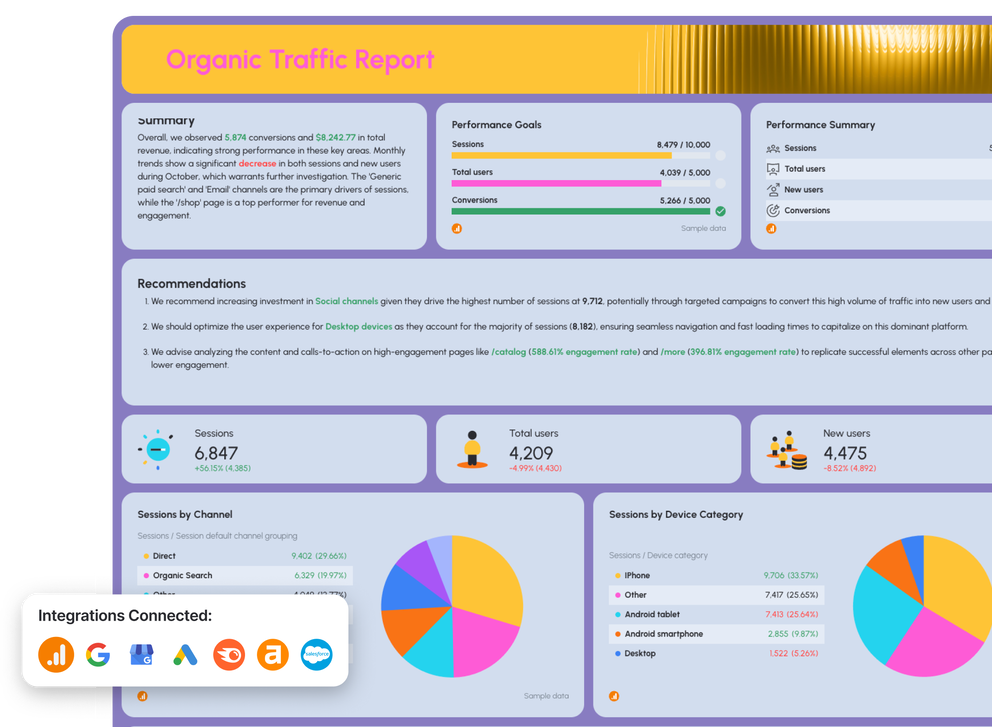
1. Summary (Executive Overview)
 What to include
- Top-line performance metrics across all channels:
- Sessions, users, conversions, revenue
- Conversion rate, ROAS, total ad spend
- Period-over-period comparison
- Wins, issues, and 3–5 clear recommendations
Why it matters
- This is the only section many execs read.
- It answers the real question: “Did our SEM efforts drive business results?”
How to explain it
- Lead with outcomes, not tactics.
- Tie paid search, paid social, and organic together into one performance story.
- Use plain language, not platform jargon.
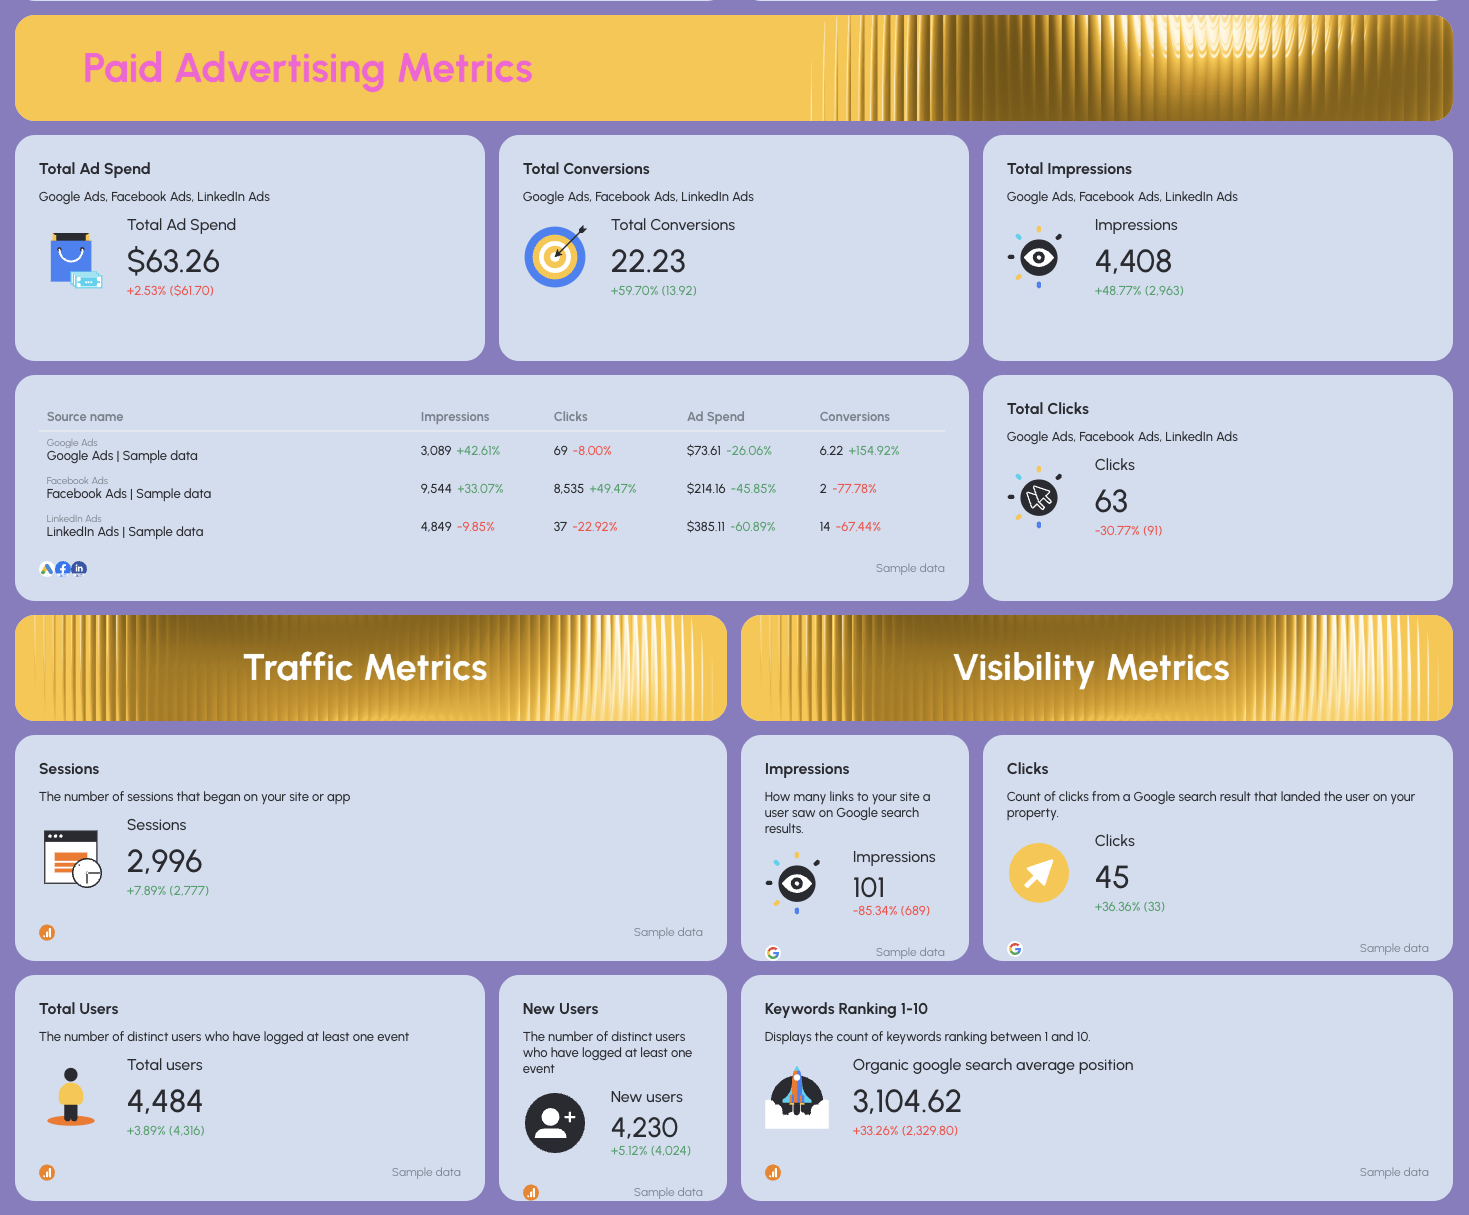
2. Google Ads
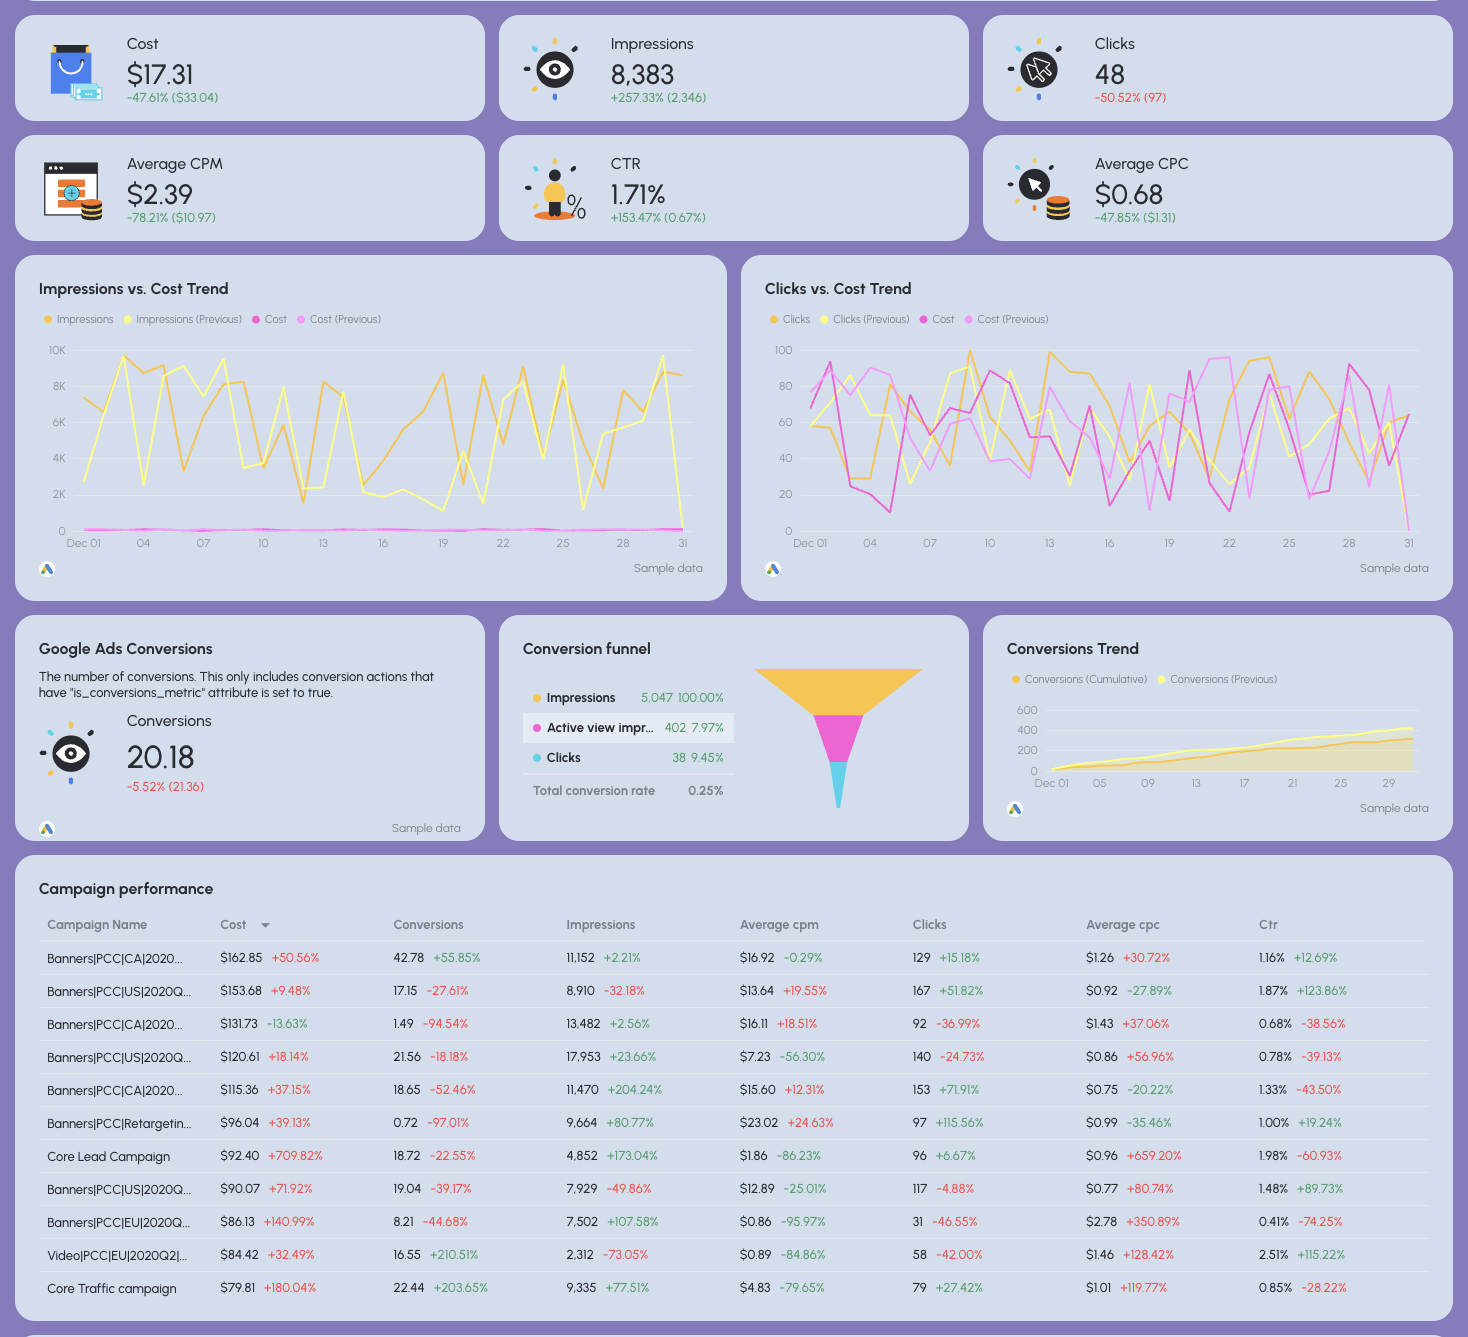
What to include
- Core PPC metrics: Impressions, clicks, CTR, CPC, cost, conversions, CPA
- Conversion funnel (impression → click → conversion)
- Performance by:
- Campaign
- Keyword
- Landing page
- Ad creative
- Spend vs. results trends
Why it matters
- Google Ads usually drives the highest-intent traffic.
- This section shows how efficiently ad spend turns into conversions.
How to explain it
- Focus on efficiency and intent, not volume alone.
- Call out which campaigns and keywords are scalable vs. wasteful.
- Always connect CPC and CPA back to revenue or leads.
3. Facebook Ads
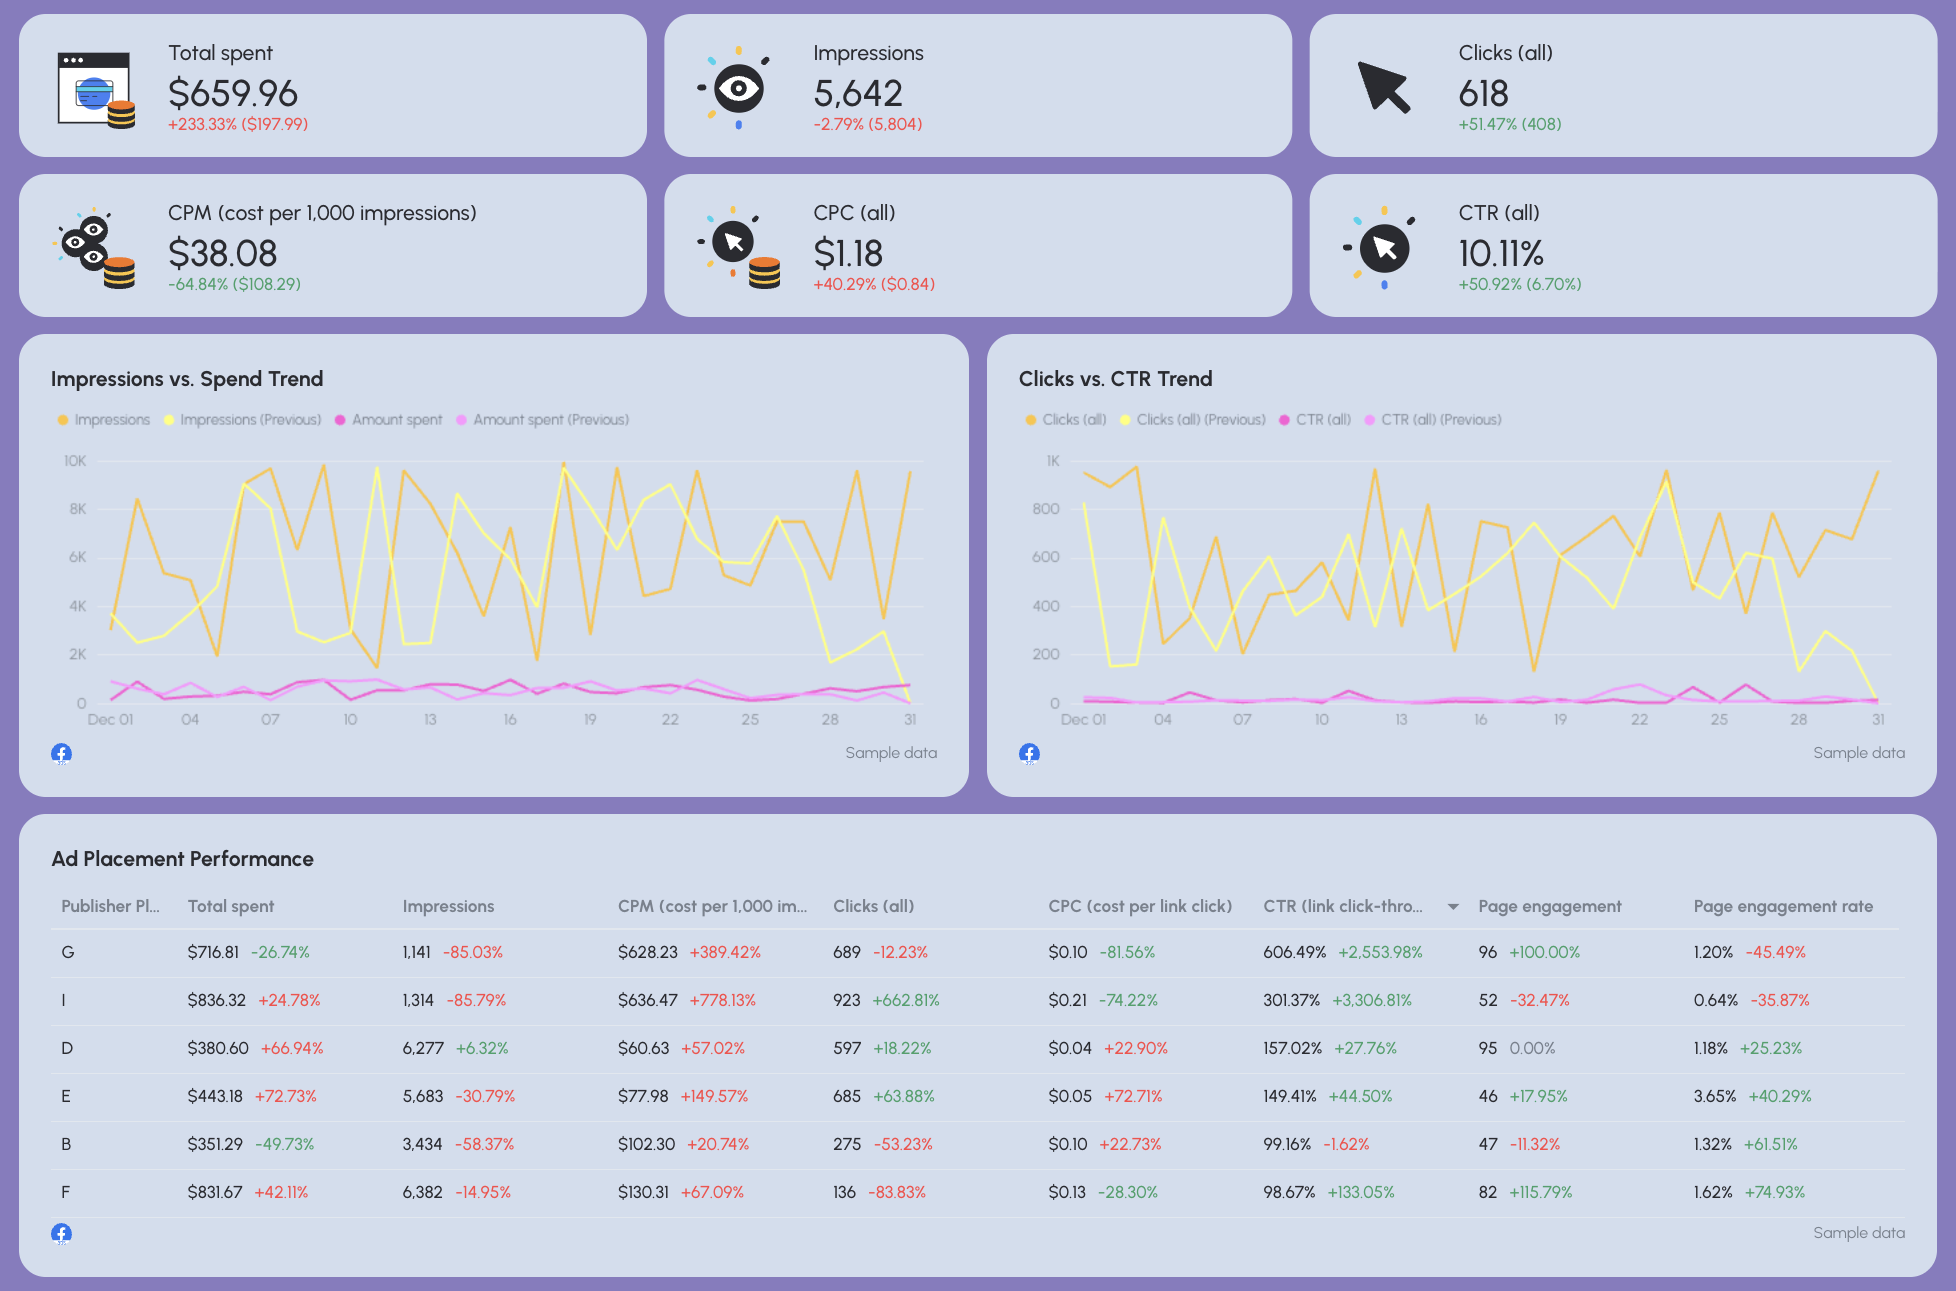
What to include
- Spend, impressions, clicks, CTR, CPM
- Conversions (on-site or offsite)
- Performance by:
- Audience (age, gender)
- Placement
- Creative
- Engagement metrics when relevant
Why it matters
- Facebook Ads often support demand generation and retargeting.
- It explains why paid social assists SEM campaigns, even when it’s not last-click.
How to explain it
- Set expectations: Facebook ≠ Google intent.
- Highlight creative and audience insights, not just conversions.
- Position it as a supporting channel for paid search and SEO.
4. LinkedIn Ads
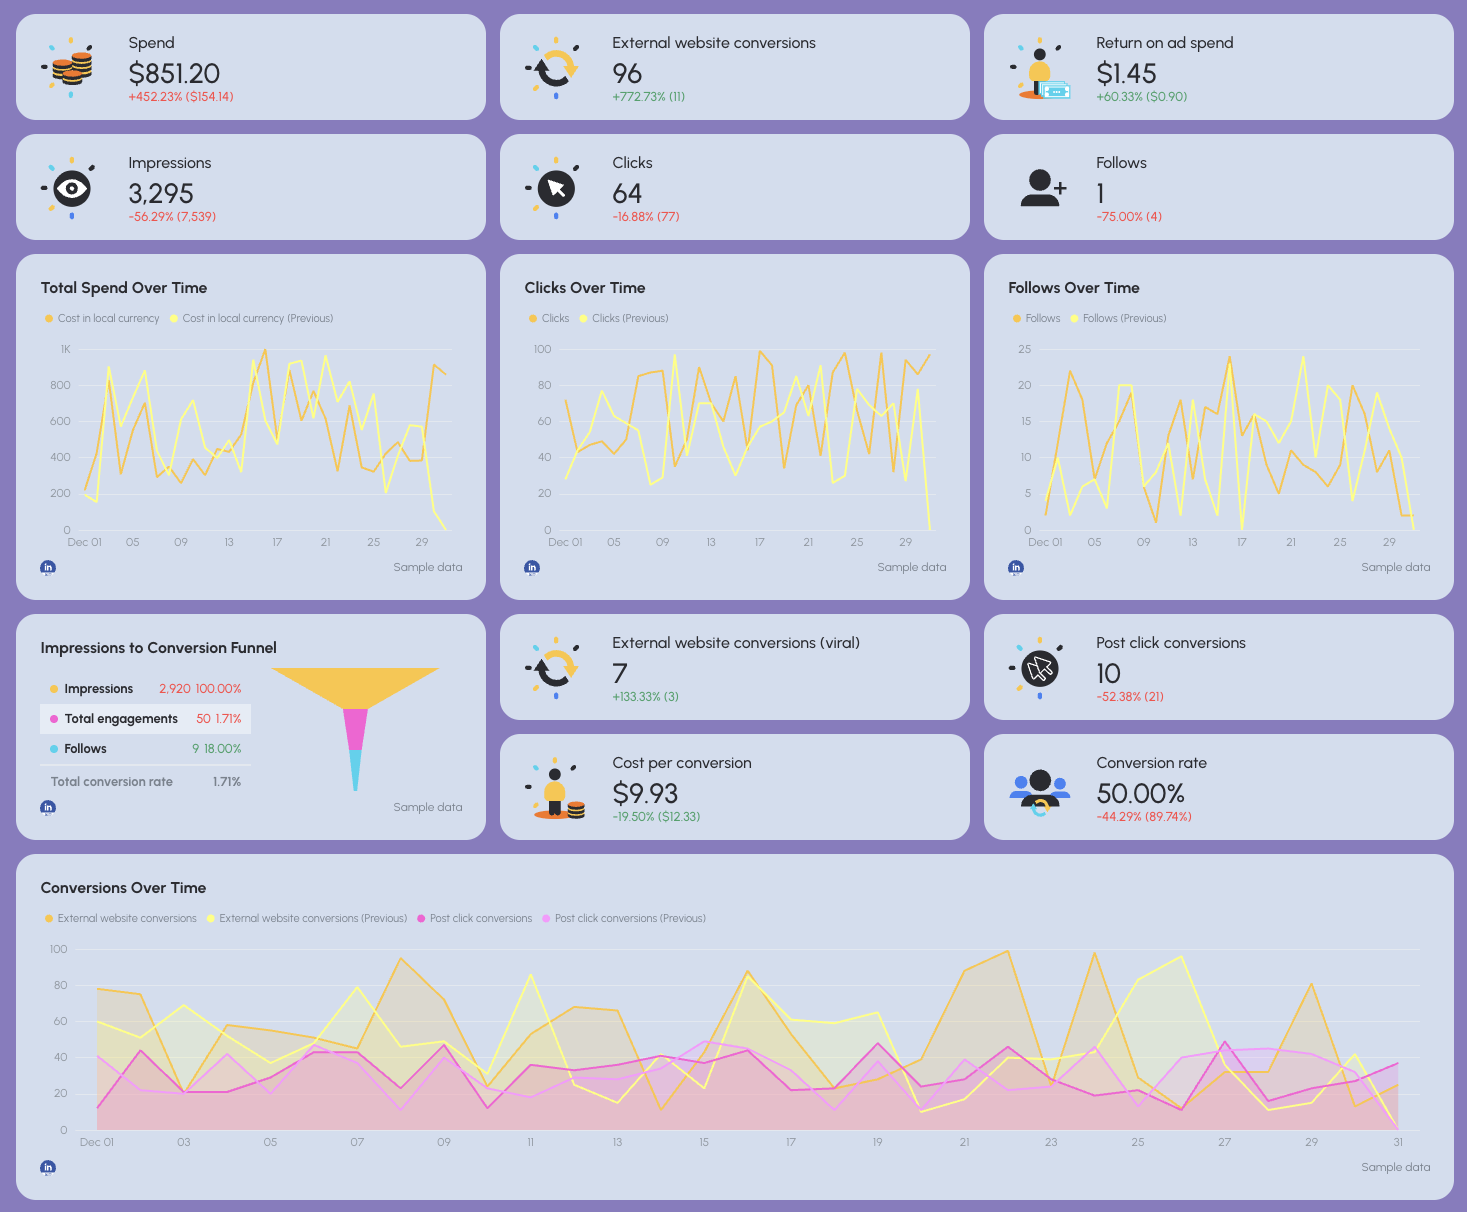
What to include
- Spend, clicks, CPC, conversions, cost per conversion
- ROAS or qualified leads (for B2B)
- Performance by:
- Job title
- Seniority
- Industry
- Geography
- Engagement actions (follows, clicks, form fills)
Why it matters
- LinkedIn Ads are expensive, this section proves quality over quantity.
- Especially critical for B2B SEM campaigns.
How to explain it
- Focus on lead quality and audience fit.
- Tie performance to pipeline impact, not just traffic.
- Explain why higher CPCs are acceptable when lead quality improves.
5. Organic Visibility (SEO)
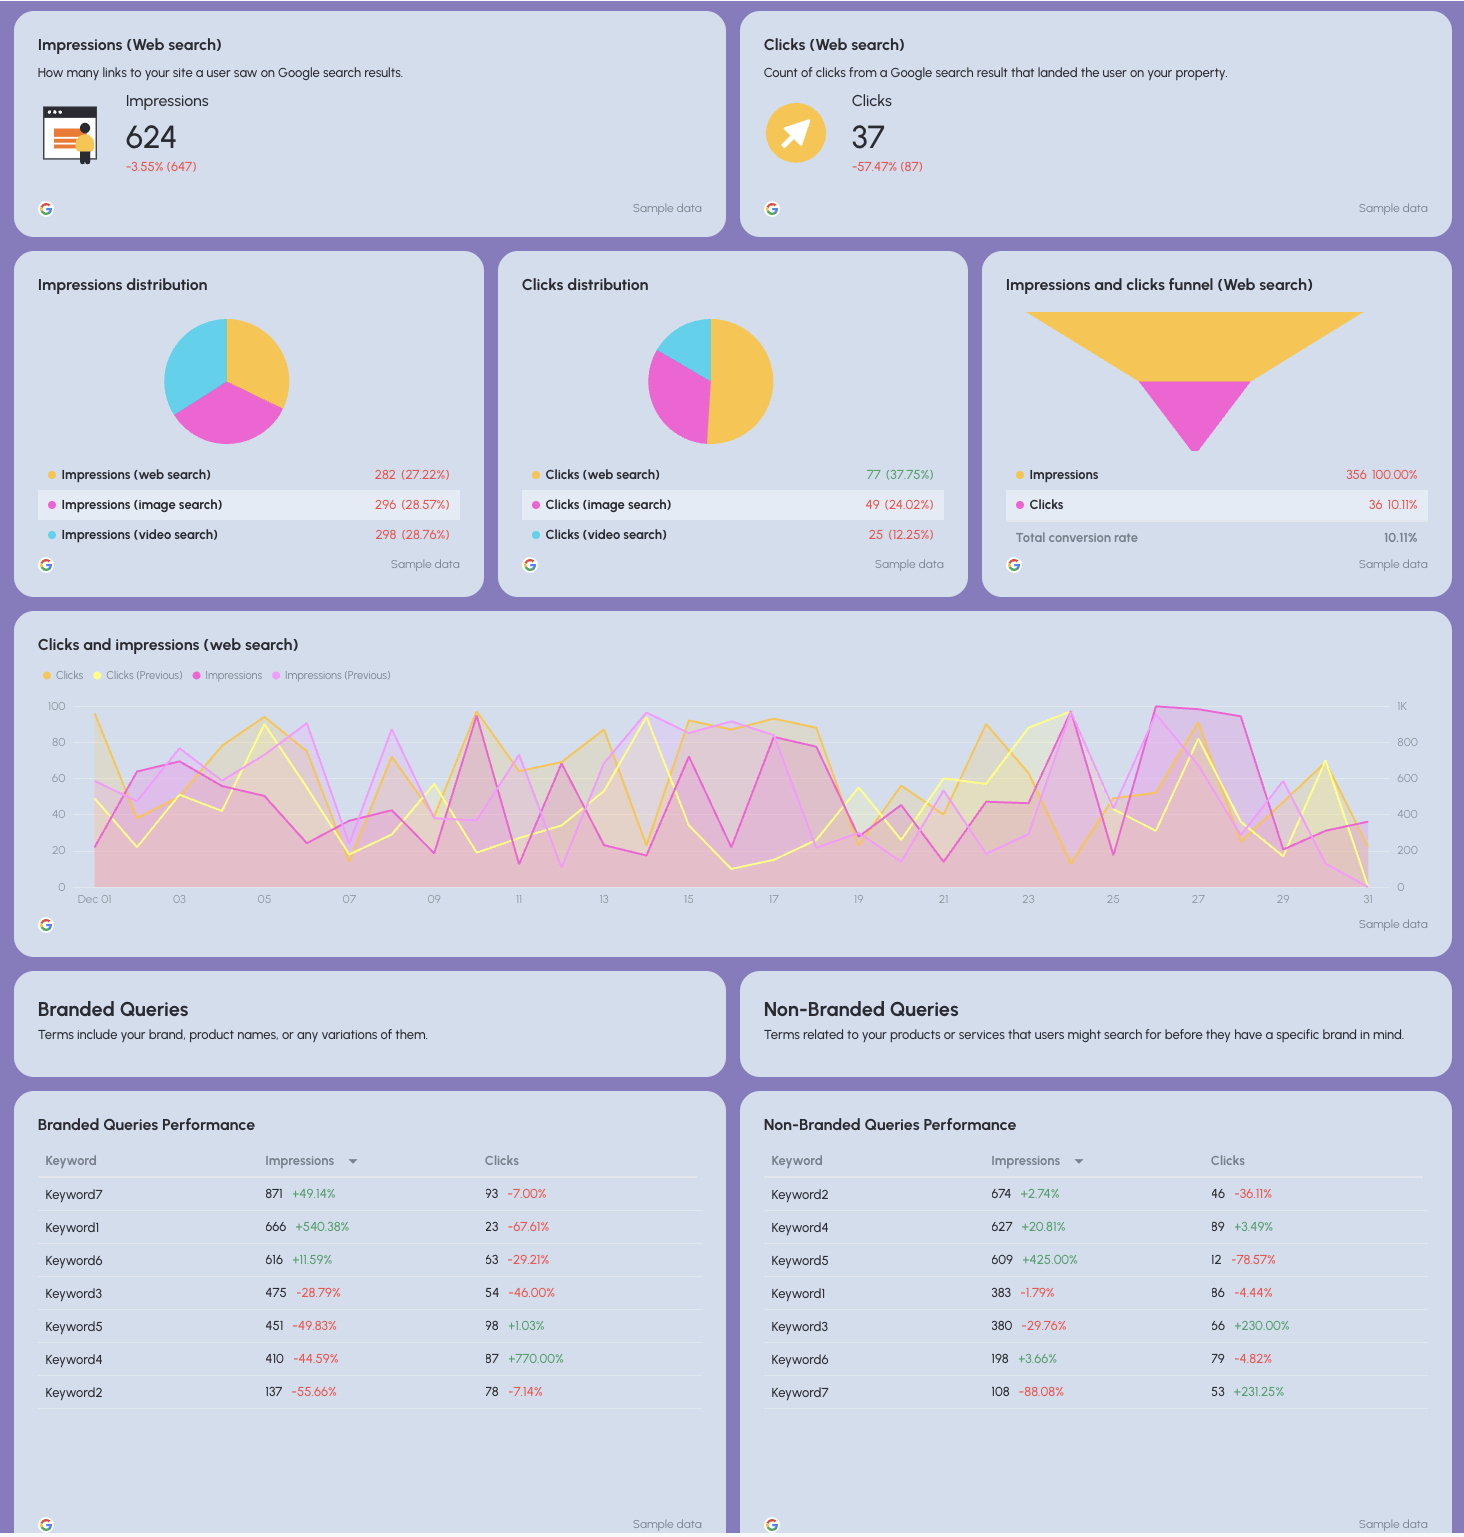
What to include
- Search impressions and clicks
- Average position
- CTR from organic search
- Branded vs. non-branded query performance
- Search type split (web, image, video)
Why it matters
- Shows how SEO supports SEM by increasing overall search visibility.
- Helps explain rising branded demand driven by paid campaigns.
How to explain it
- Frame SEO as demand capture, not just rankings.
- Highlight non-branded visibility growth as future SEM efficiency.
- Avoid deep SEO jargon, keep it outcome-focused.
6. Organic Conversions (SEO)
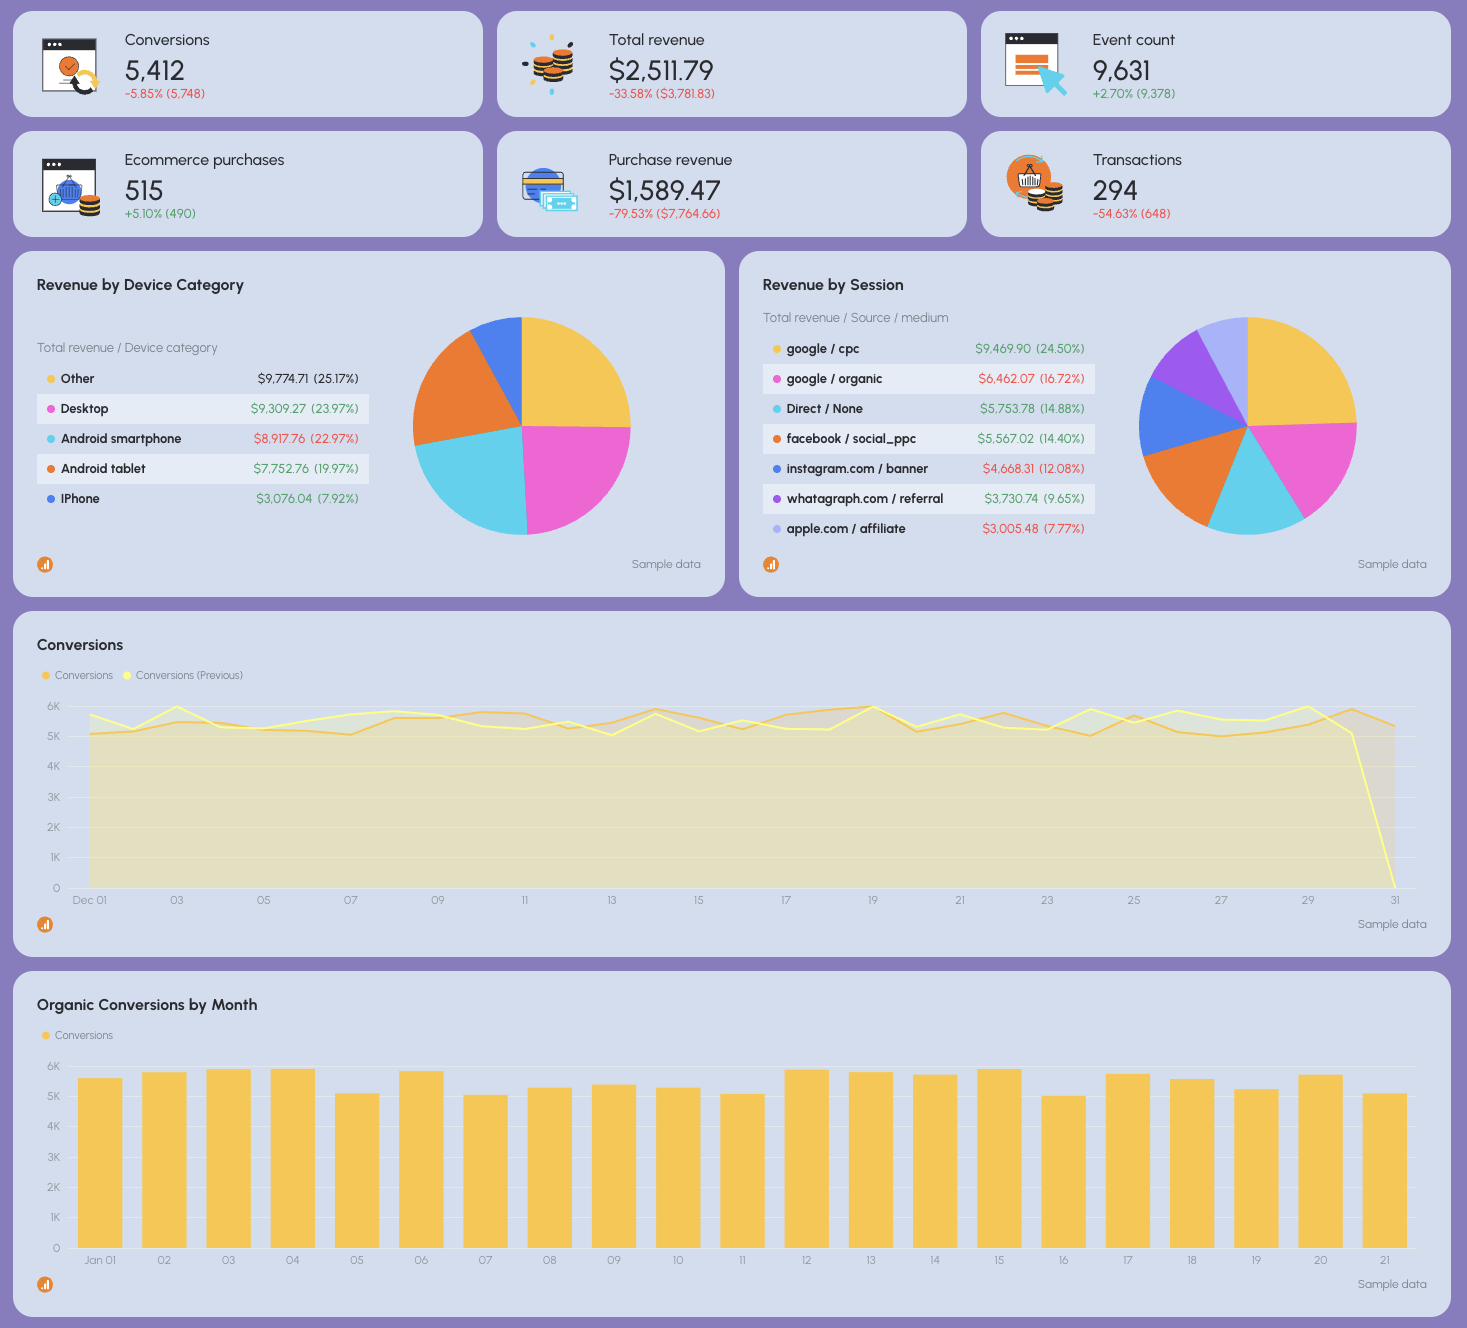
What to include
- Organic conversions and revenue
- Conversion rate
- Top converting pages
- Revenue by device, source, and landing page
- Trends over time
Why it matters
- This proves SEO’s direct business impact.
- Helps justify investment beyond paid campaigns.
How to explain it
- Connect organic traffic to real revenue or leads.
- Show how SEO reduces dependency on paid ad spend.
- Emphasize compounding returns over time.
7. Organic Traffic (SEO)
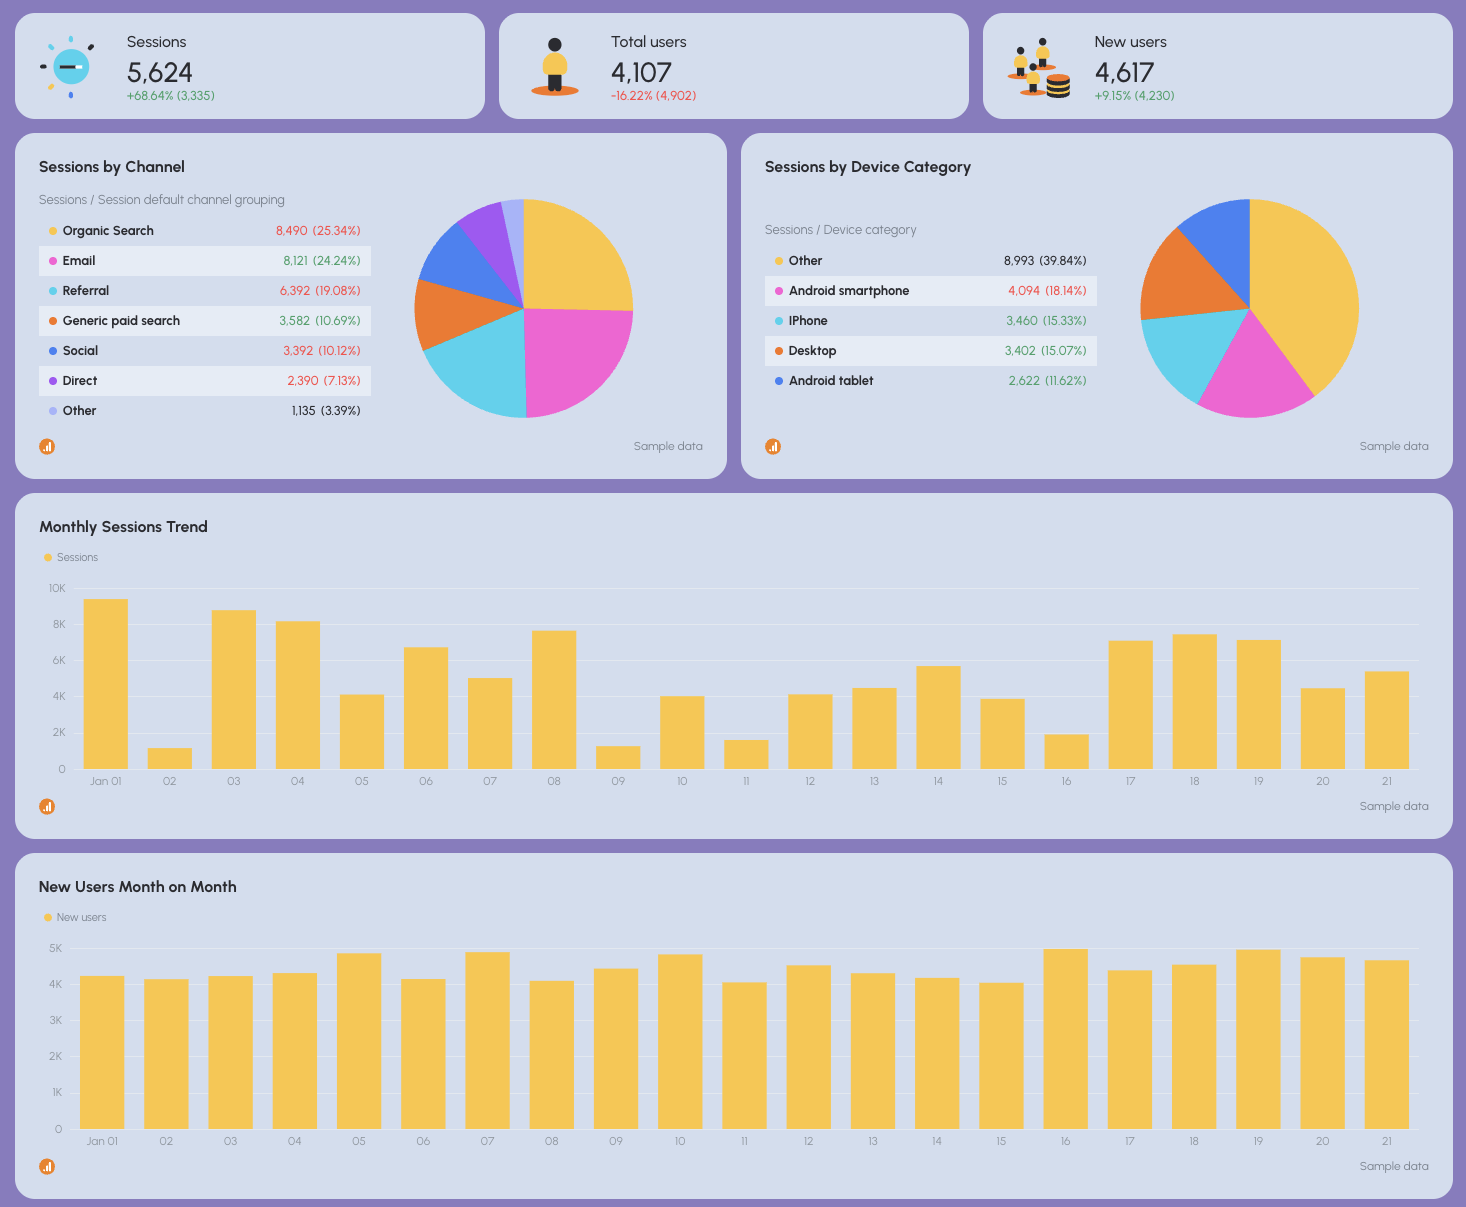
What to include
- Sessions, users, new users
- Traffic by channel and device
- Engagement rate and bounce rate
- Top-performing pages
- Monthly traffic trends
Why it matters
- Explains where organic demand is coming from and how users behave.
- Supports both SEO and SEM landing page optimization.
How to explain it
- Focus on quality traffic, not just growth.
- Highlight pages that support conversions downstream.
- Tie insights back to campaign optimization opportunities.
8. AI Traffic
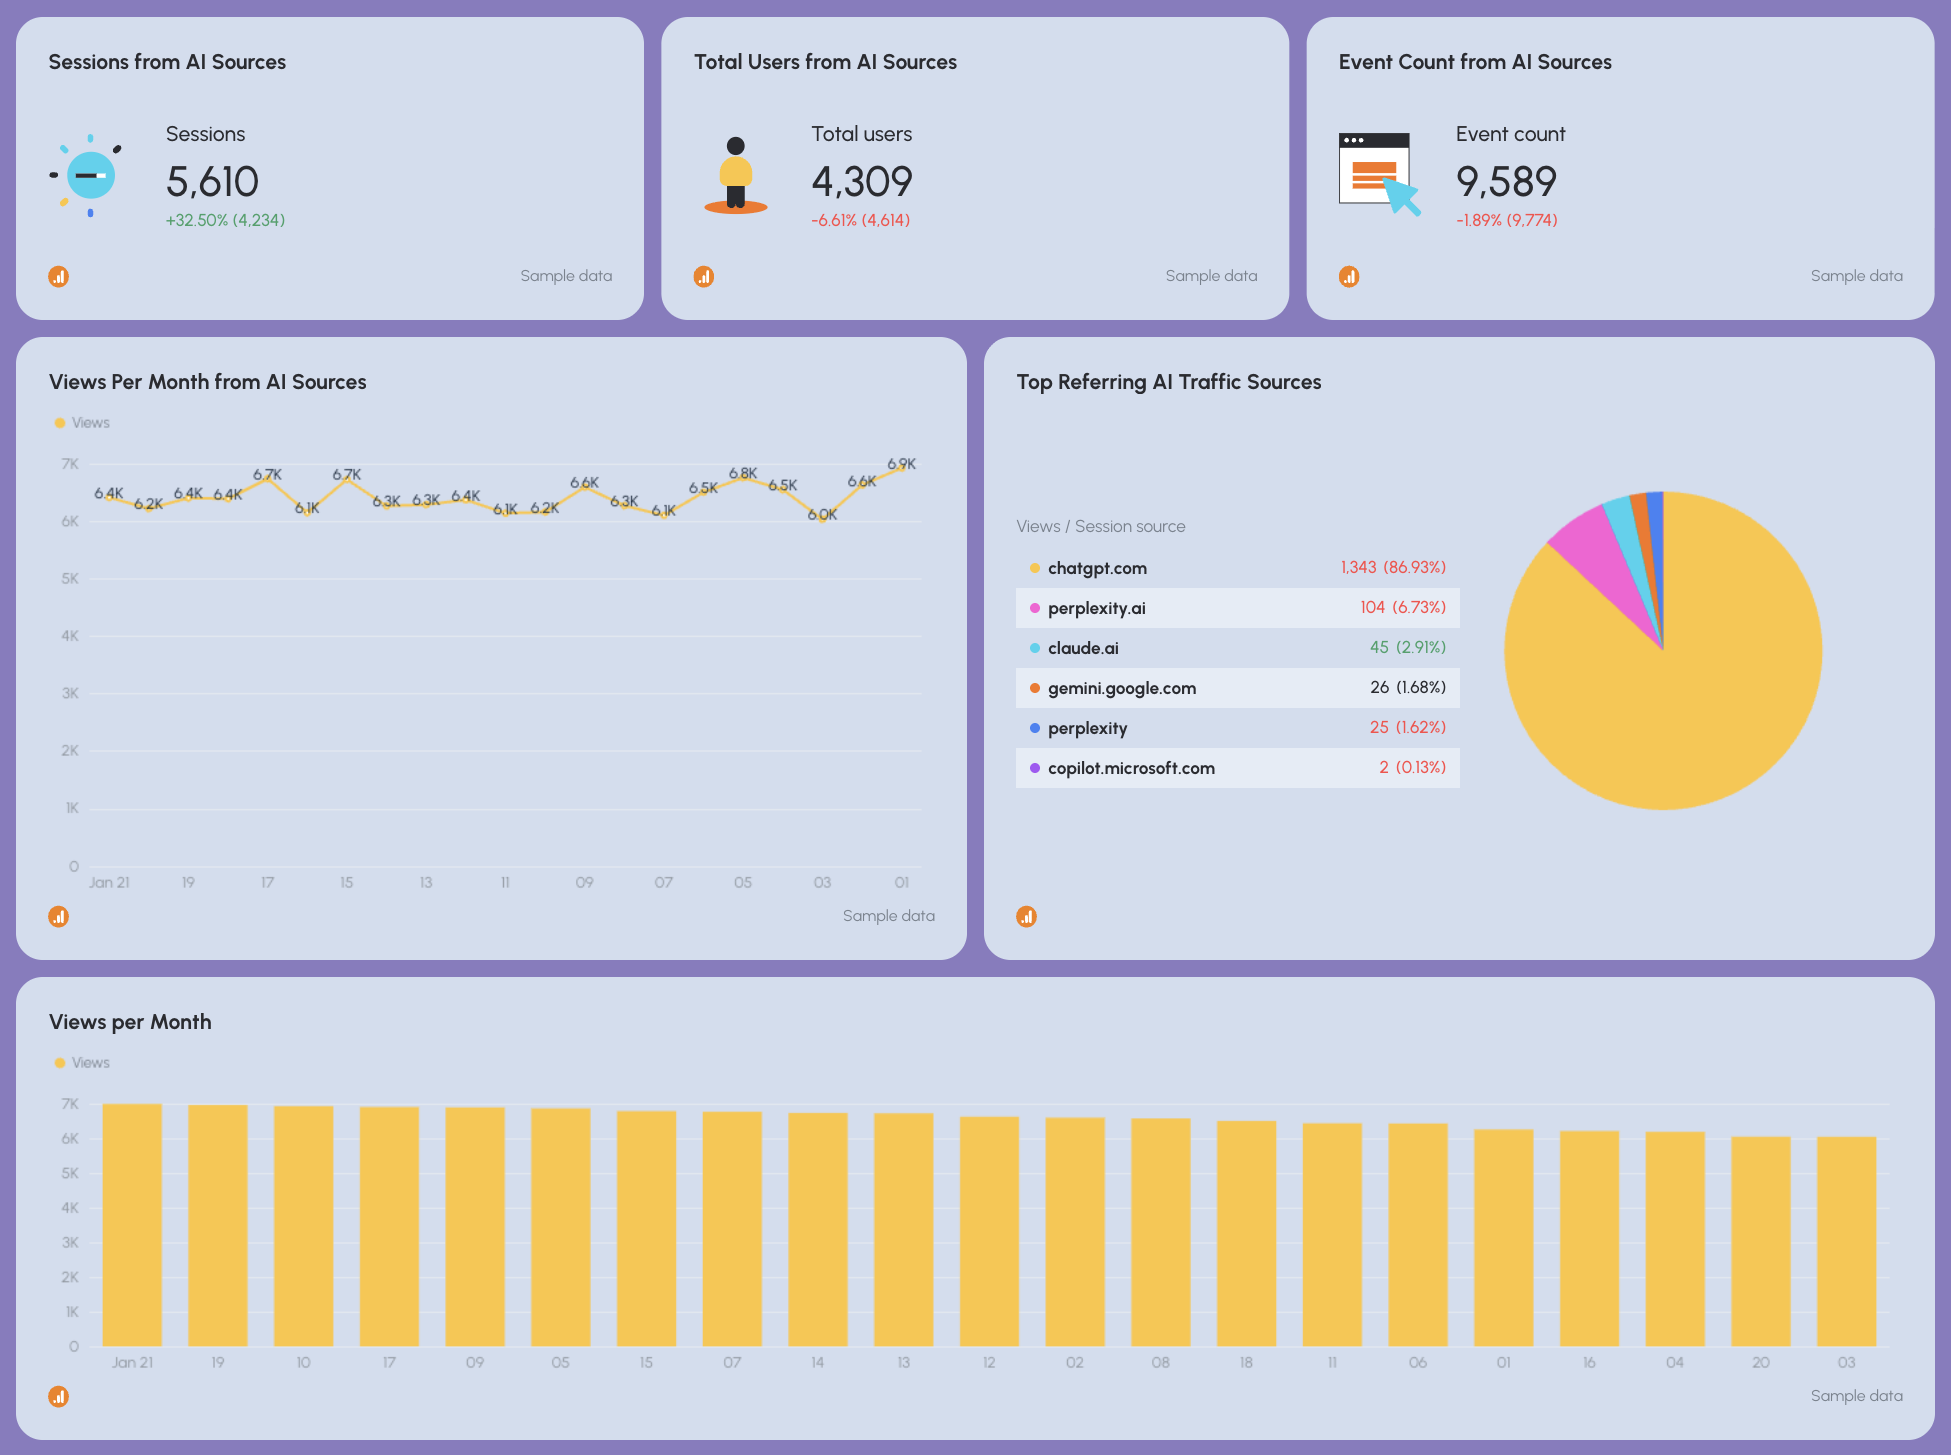
What to include
- Traffic and conversions from AI-driven sources (e.g. ChatGPT, Perplexity)
- Engagement metrics
- Trend over time
Why it matters
- AI-assisted discovery is emerging as a new acquisition channel.
- Early visibility helps future-proof reporting.
How to explain it
- Position as exploratory, not a core KPI yet.
- Track trends, not perfection.
- Highlight learning opportunities, not hard ROI expectations.
9. Local Search
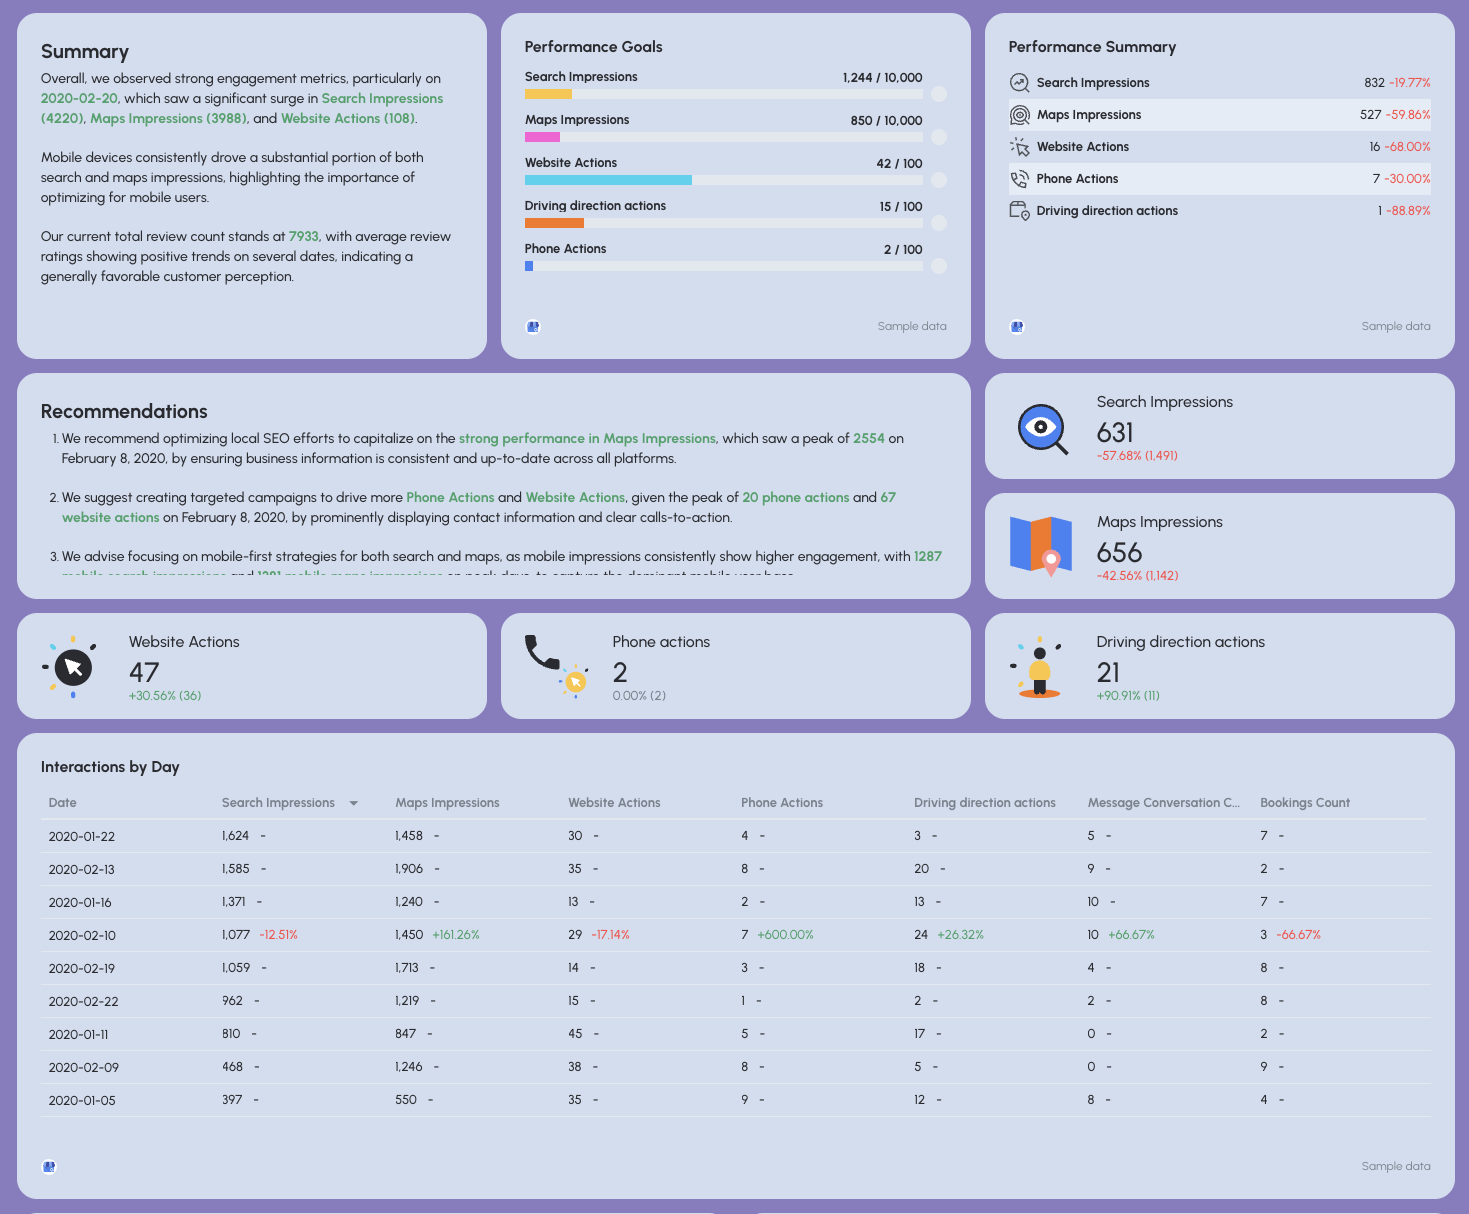
What to include
- Search and Maps impressions
- Website actions, phone calls, direction requests
- Reviews and average rating
- Mobile vs. desktop performance
Why it matters
- Critical for location-based SEM and hybrid local campaigns.
- Bridges paid search, organic search, and offline conversions.
How to explain it
- Tie local visibility to real-world actions.
- Emphasize mobile behavior and intent.
- Show how local SEO improves paid campaign efficiency.
10. Keyword Rankings
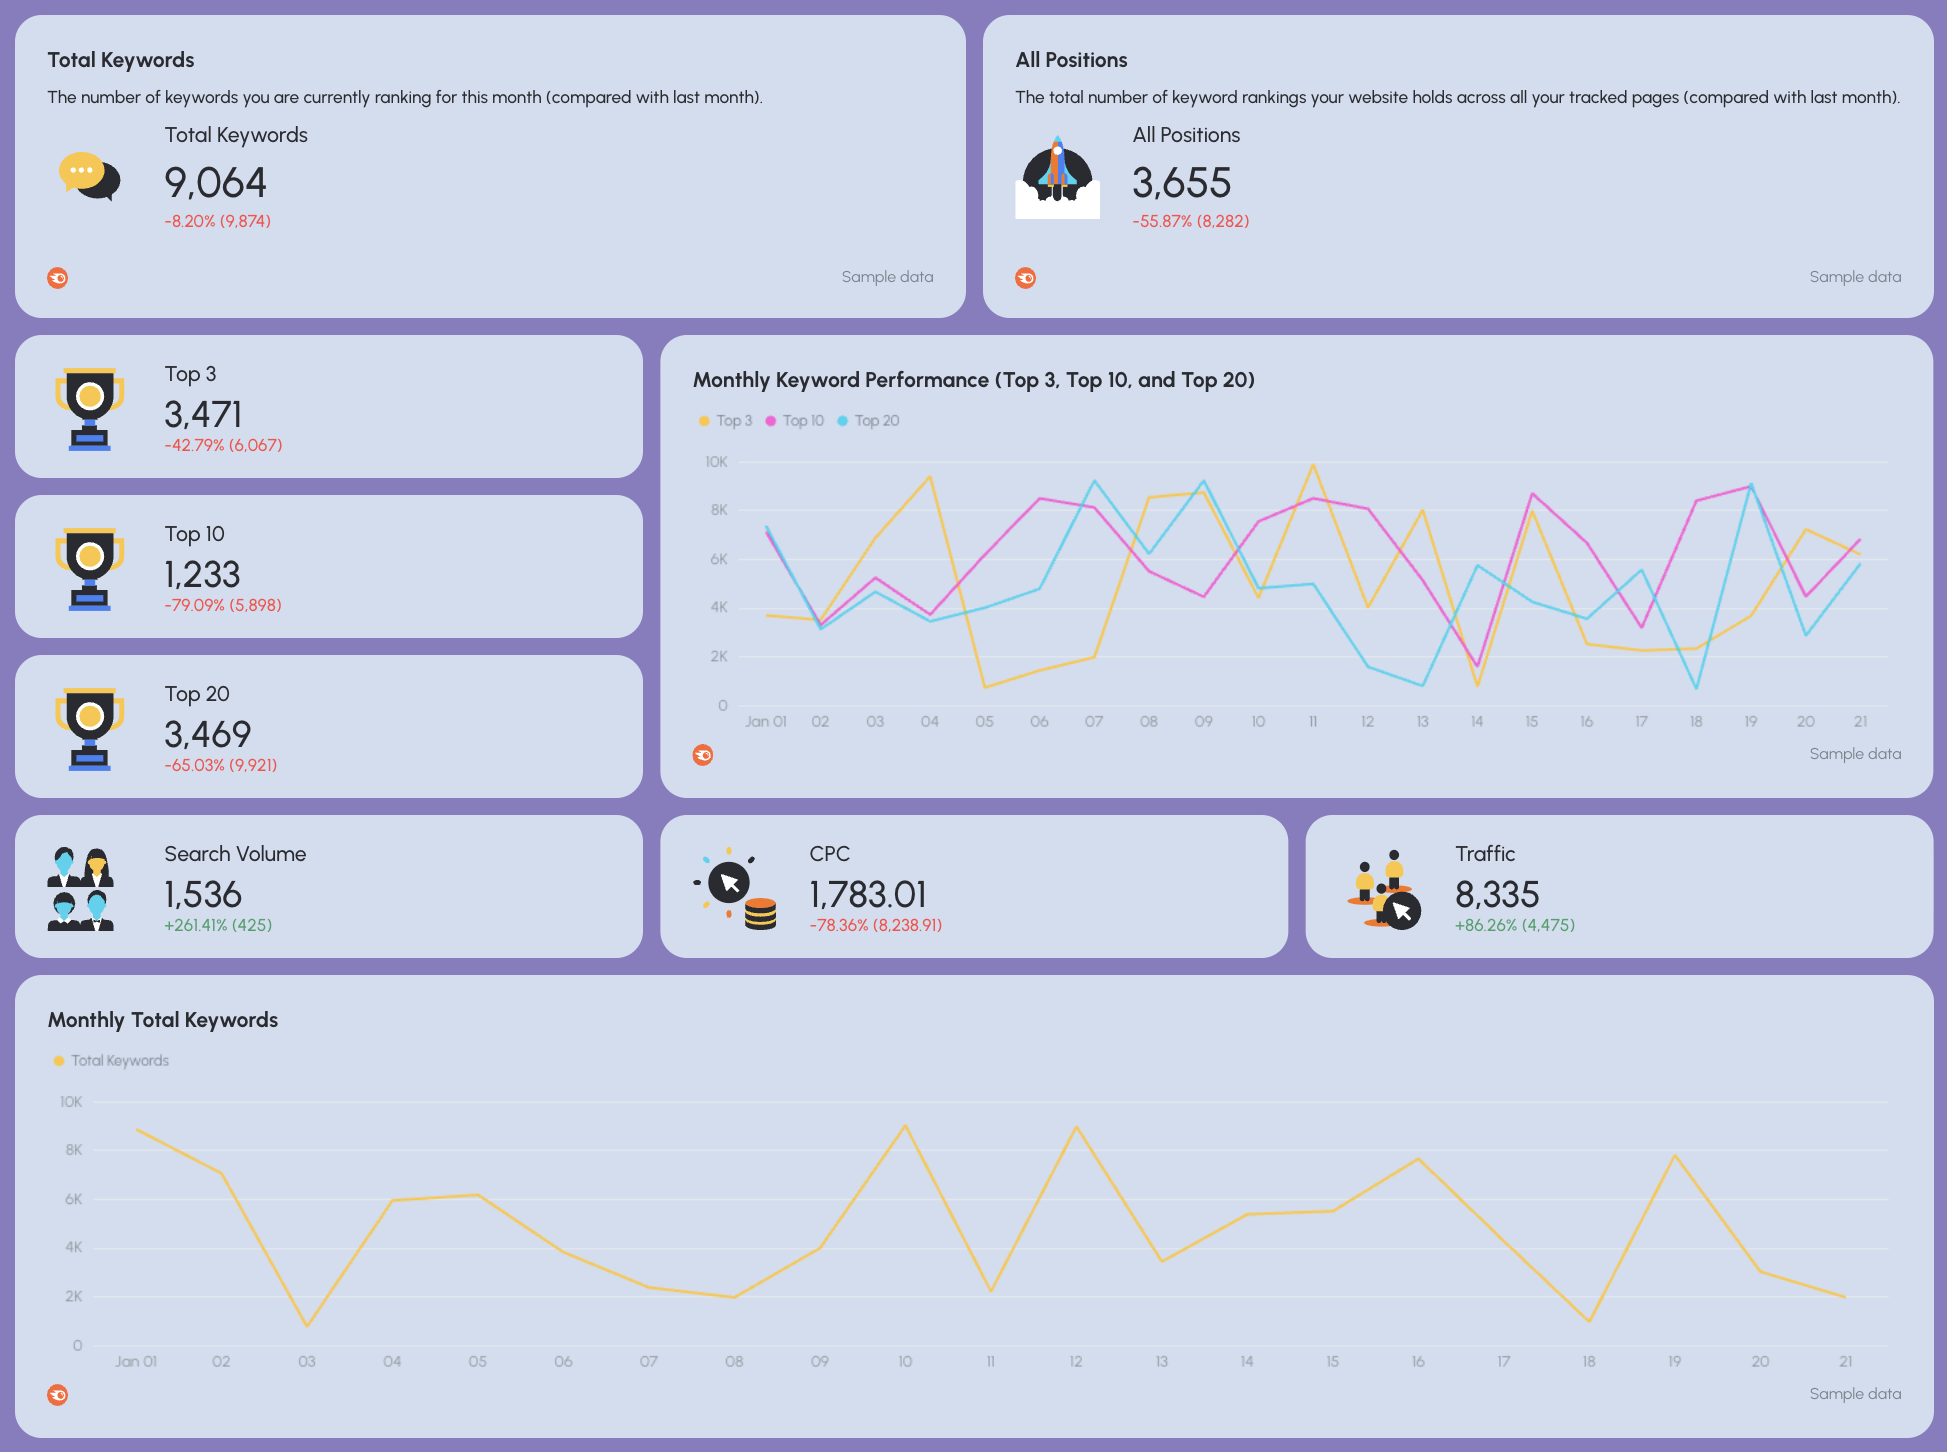
What to include
- Keywords ranking in positions 1–10
- Ranking changes over time
- Branded vs. non-branded split
- Keywords supporting paid campaigns
Why it matters
- Rankings influence CPC, Quality Score, and CTR.
- Strong SEO rankings reduce paid dependency.
How to explain it
- Don’t obsess over every keyword.
- Focus on keywords that impact conversions and paid efficiency.
- Position rankings as a support metric, not the end goal.
11. Backlinks
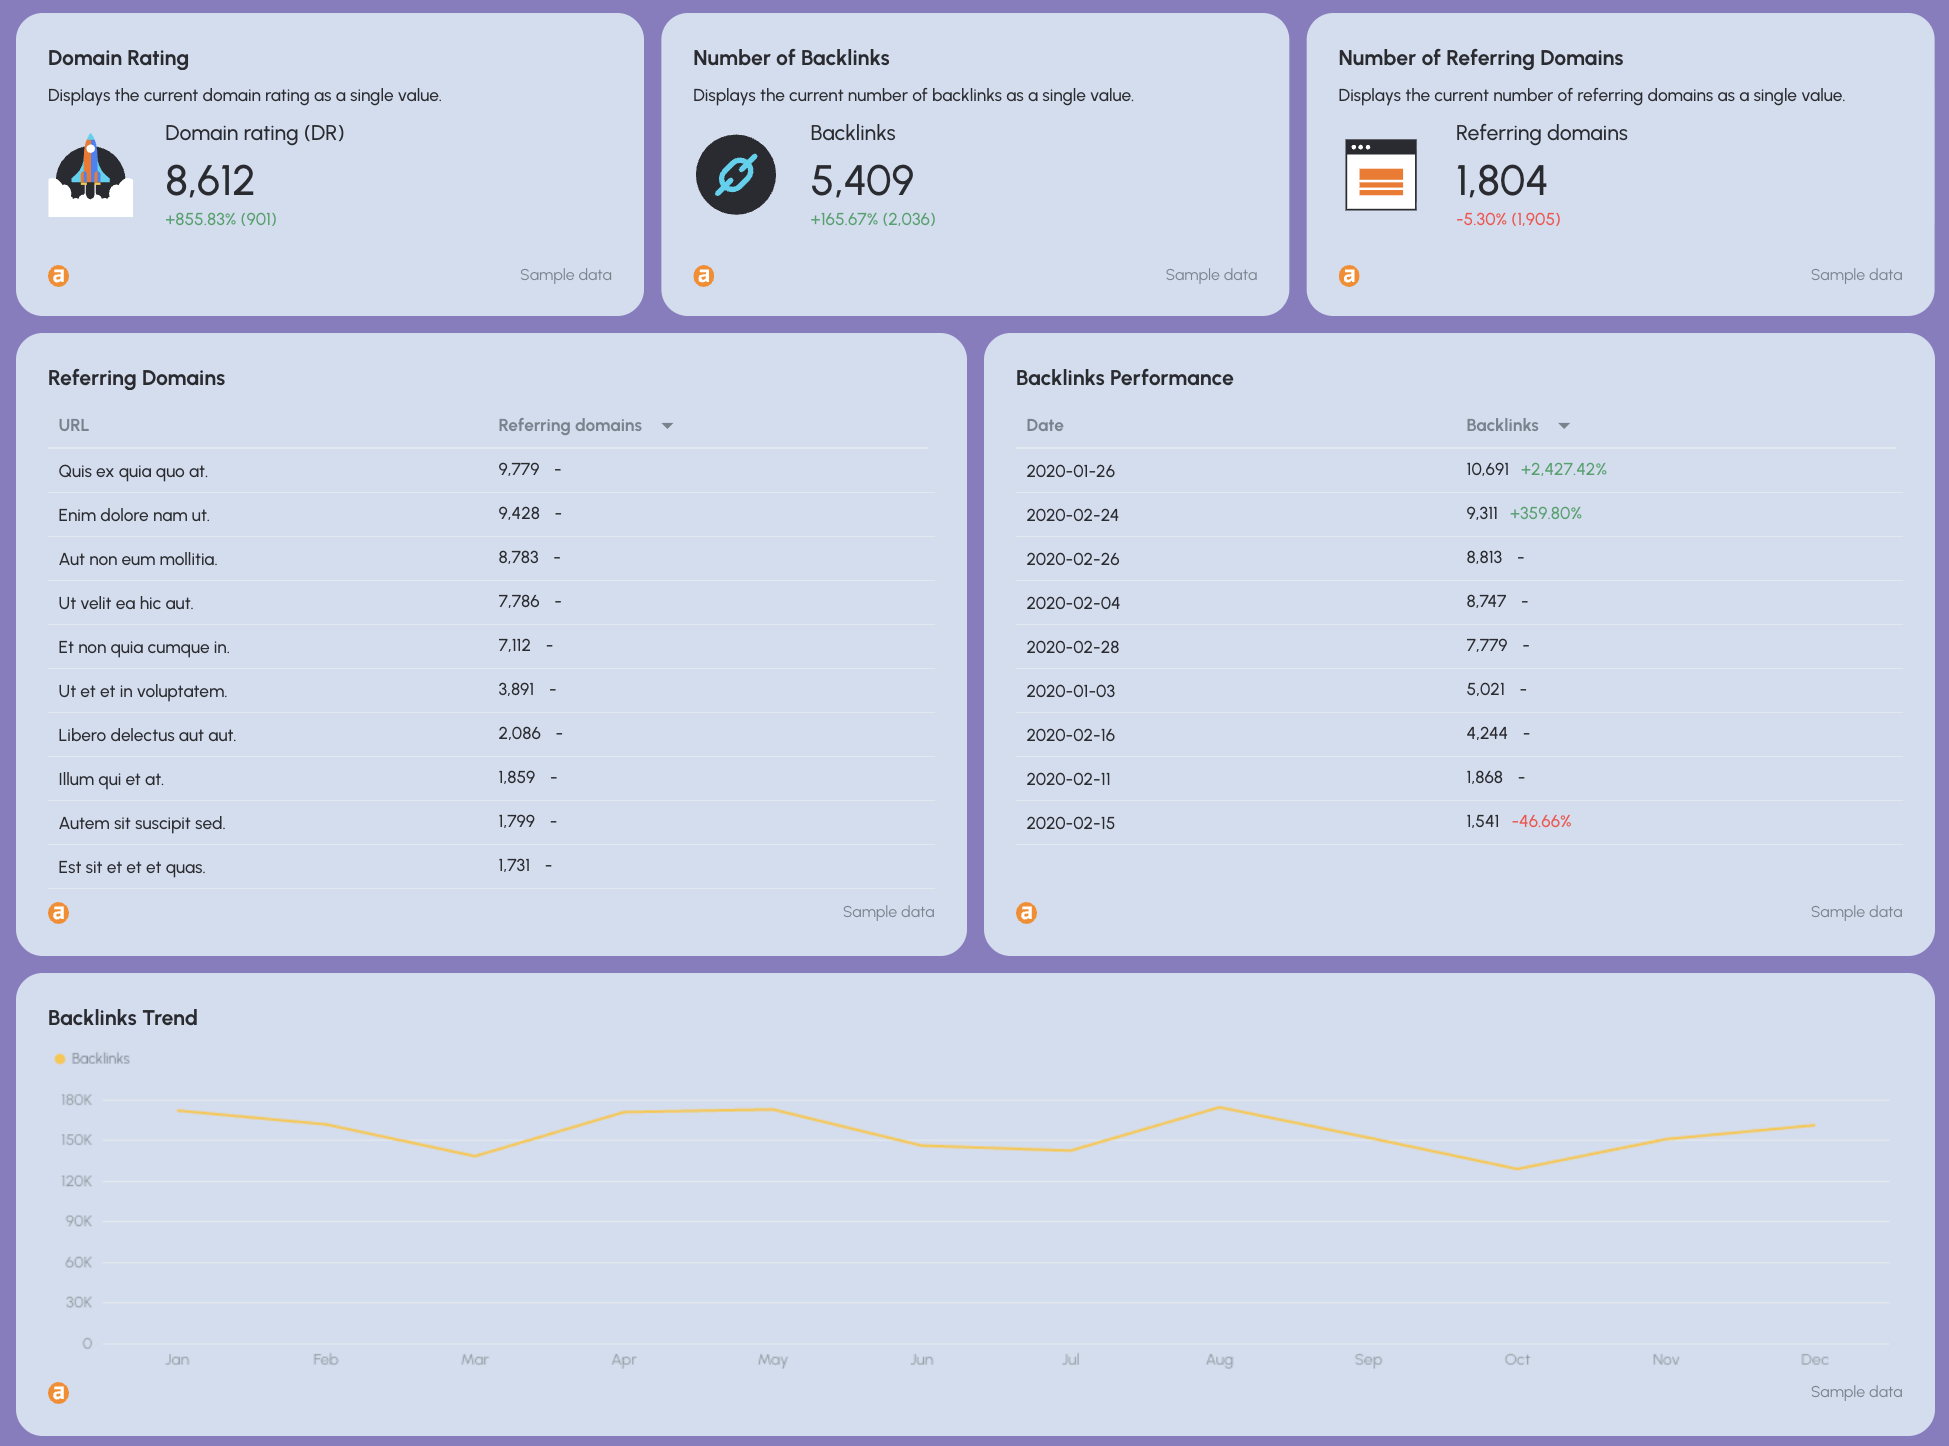
What to include
- Total backlinks and referring domains
- New vs. lost links
- Link quality indicators
- Pages attracting links
Why it matters
- Backlinks underpin organic visibility and long-term SEM efficiency.
- Strong authority lowers future acquisition costs.
How to explain it
- Frame backlinks as infrastructure, not vanity metrics.
- Explain how authority supports rankings and paid performance.
- Keep it high-level for execs.
–
Including all of these sections make your SEM report one cohesive story:
- Paid search drives immediate demand.
- Paid social amplifies reach.
- SEO compounds results.
- Local and AI traffic show where acquisition is heading next.
That’s exactly how Whatagraph’s SEM report template is structured, and how high-performing marketing teams use it in Whatagraph.


