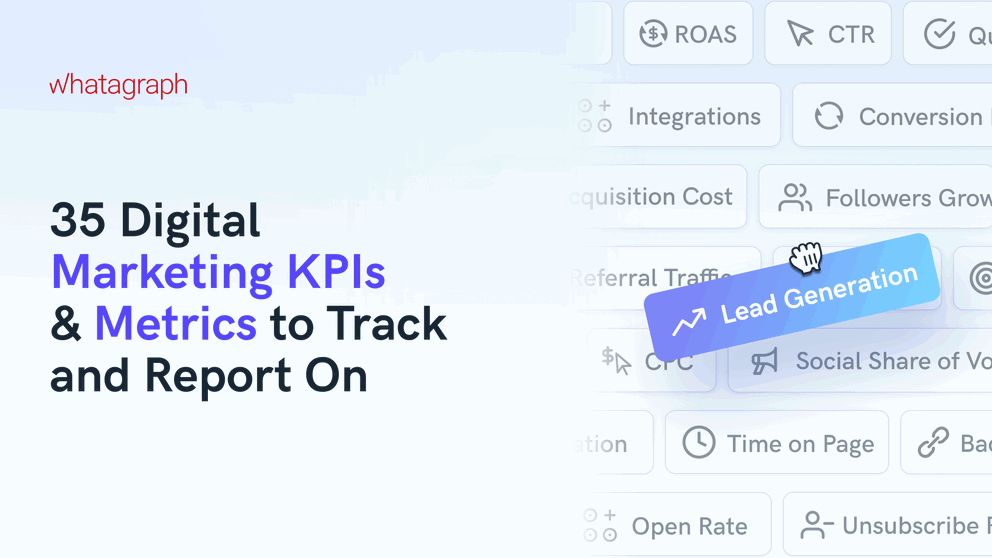
35 Digital Marketing KPIs and Metrics to Track in 2026
You cannot improve what you don’t measure. The best way to see how your marketing campaigns are performing is to check on your main KPIs and metrics. But where should your marketing efforts and resources be directed?

Oct 21 2024●6 min read


- What Are the Key Types of Digital Marketing KPIs and Metrics?
- 7 Most Important SEO KPIs and Metrics
- 10 Most Important Paid Media KPIs and Metrics
- 6 Most Important Social Media KPIs and Metrics
- 7 Most Important Email Marketing KPIs and Metrics
- 5 Most Important Content Marketing KPIs and Metrics
- How to Track and Report on Digital Marketing Metrics and KPIs?
You’re running marketing campaigns on several channels.
The numbers are looking good, but you need to keep an eye on key metrics and send regular reports.
But you’re lost in a sea of data.
Which metrics should you track and report on so clients (or the C-Suite) understand the value of your marketing campaigns?
We asked three digital marketers:
- Brandon Rollins, Founder & CEO of Pangea Marketing Agency,
- Joey Randazzo, CEO of Portland SEO Growth Partners, and
- Erika Castro, Growth Marketing Manager at Erika Castro-Morrison
…this question and compiled their insights in this article.
We’ll cover the key metrics for the five main digital marketing channels:
- SEO
- Paid media
- Social media
- Email marketing
- Content marketing
What Are the Key Types of Digital Marketing KPIs and Metrics?
To present the most important marketing metrics, we’re going to split them into five main digital marketing channels.
SEO: This channel can help you become more visible in Google searches, drive traffic, and improve conversions. The most important metrics here are:
- Organic Traffic
- Keyword Rankings
- Backlinks
Paid media: Here you want to measure the effectiveness of your paid digital advertising campaigns, such as PPC and display ads:
- Cost Per Click
- Click-Through Rate (CTR)
- Conversion Rate
Social media: These metrics help you measure engagement, audience growth, and the overall impact of your social media efforts:
- Engagement Rate
- Followers Growth
- Social Share of Voice (SSoV)
Email marketing: These KPIs show you how well your emails increase your engagement and conversions:
- Open Rate
- Click-Through Rate (CTR)
- Unsubscribe Rate
Content marketing: Content metrics give you a better view of how well your content matches the interest of your readers and helps drive desired actions:
- Time on Page
- Bounce Rate
- Lead Generation
All these metrics live on different marketing platforms and tools, so tracking them together is often challenging.
This is especially true if you export data from each platform to stitch it together in sheets.
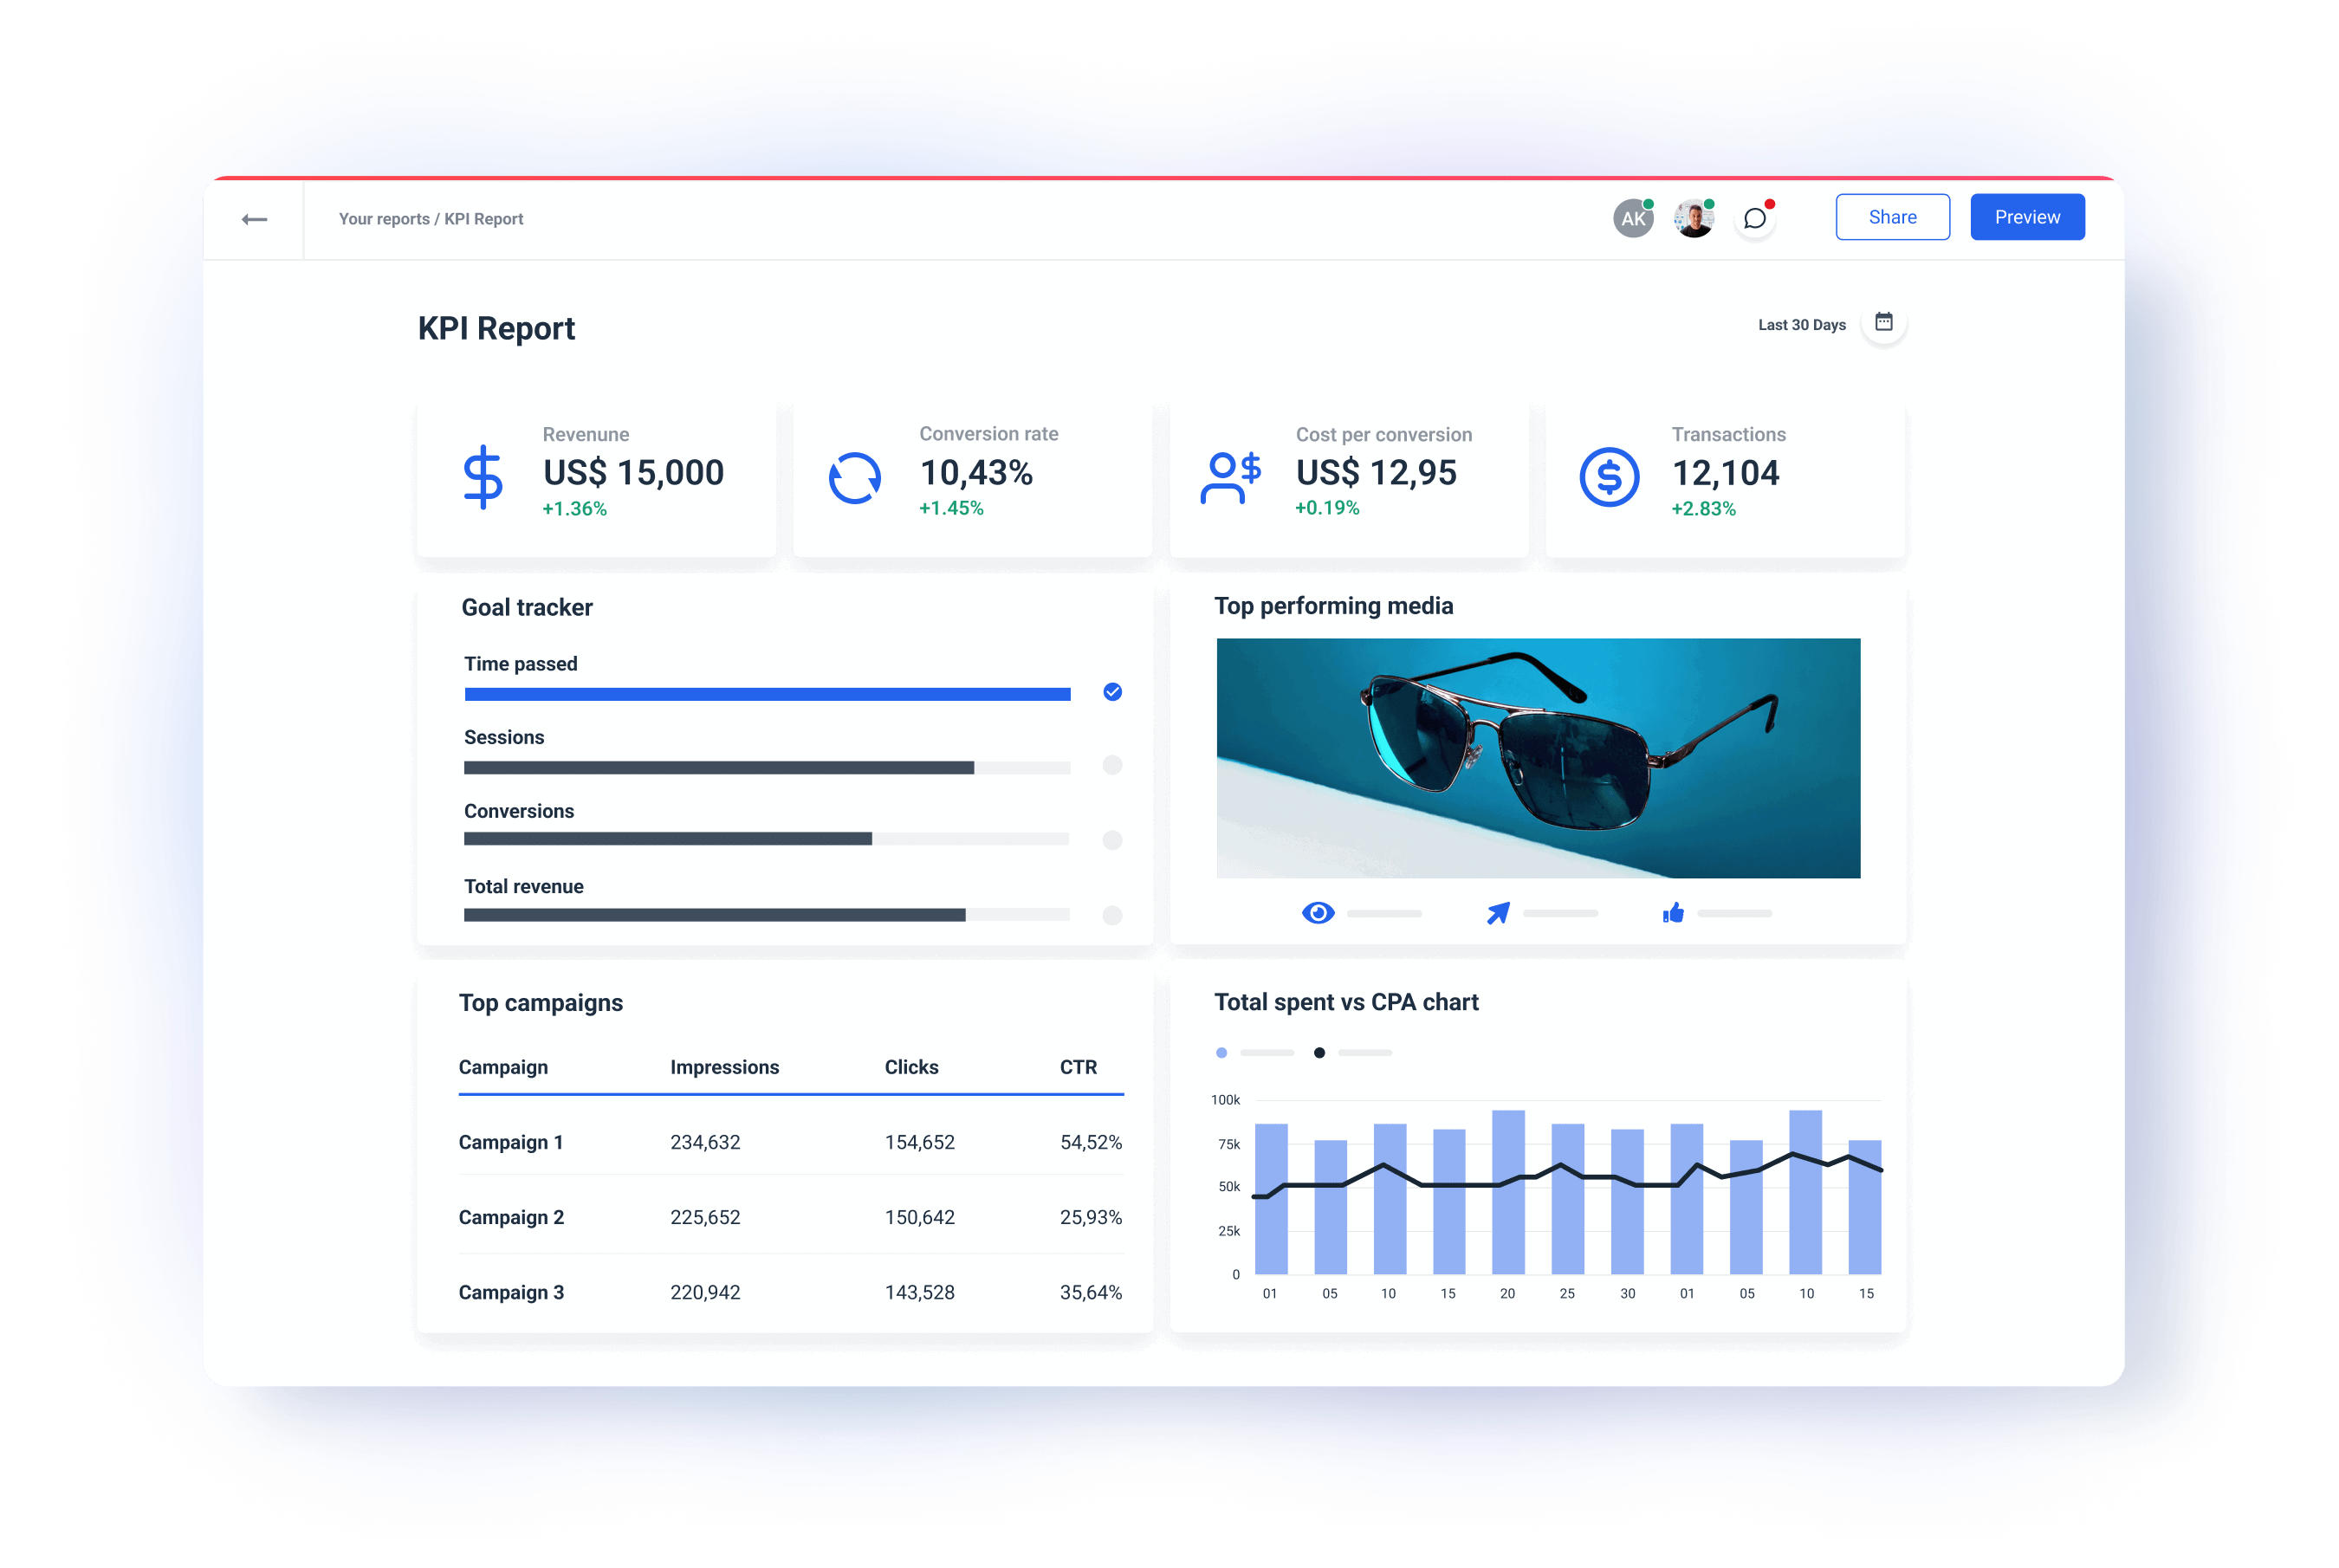
Whatagraph makes the whole job a lot easier.
Instead of spending a whole day collecting metrics from all tools and fitting them into your report, with Whatagraph, you can connect all your sources in a few clicks and use this KPI Report Template to create a stunning visual report.
7 Most Important SEO KPIs and Metrics
SEO metrics show how well a website ranks in search engines and attracts organic traffic.
Here are the seven SEO metrics top agencies are tracking and reporting on:
Organic Traffic
Organic traffic measures the website traffic that you get from organic search. It shows the number of visitors who land on your website from unpaid search results on Google.
Why it’s important: Organic traffic directly shows how successful your SEO strategy is. The more organic traffic, the higher your website ranks for relevant keywords.
You can track this metric in Google Analytics under "Acquisition" > "Channels" > "Organic Search".
Keyword Rankings
Keyword ranking shows the ranking position of the keywords you target. It measures how well is your website optimized for specific search terms on Google.
Why it’s important: High keyword rankings help you increase visibility and traffic.
To track keyword rankings, you can use tools like Ahrefs, Semrush, or Google Search Console to find rank positions for specific keywords.
Joey Randazzo of SEO Growth Partners underlines the importance of local searches:
“We track keyword rankings for our clients revenue-driving keywords daily and by location. For example, if we're working with a hair salon in Portland, OR, we're tracking how they're ranking for keywords like "best hair salon Portland" or "balayage in Portland.".”
Backlinks
This metric shows the number of external links that point to your website. It measures your link-building success and domain authority.
Why it’s important: Backlinks are a key ranking factor for Google, as they signal that your site is relevant and has authority. The higher your domain authority, the easier it will be to build backlinks.
You can easily find this metric with tools like Ahrefs and Moz.
Domain Authority (DA)
Domain authority is a ranking score that predicts how well your website will rank on search engine results pages (SERPs). It measures the overall strength of your website.
Why it’s important: A higher DA usually leads to better rankings and trust score.
Click-Through Rate (CTR)
CTR is the percentage of users who click on your website’s link after seeing it in search results. It shows how good your meta titles and descriptions are in attracting clicks.
Why it’s important: A higher CTR shows that your website is interesting to searchers, even if it's not ranked #1.

Bounce Rate
This metric shows the percentage of visitors who leave your website after viewing only one page. It is related to user engagement and the relevance of your website content for the people who click on it.
Why it’s important: A high bounce rate may be a sign of poor user experience or irrelevant content.

Conversion Rate from Organic Traffic
The conversion rate in SEO measures how well your website converts organic traffic. It shows the percentage of organic visitors who complete a desired action such as a purchase or sign-up.
Why it’s important: A high conversion rate means your SEO efforts are driving qualified traffic.

“We track conversions through GA4, web form data (adding a field that asks users 'how did you hear about us?') as well as regular meetings with our clients, we're able to understand if the SEO campaign is driving more qualified conversions over time.”
— — —
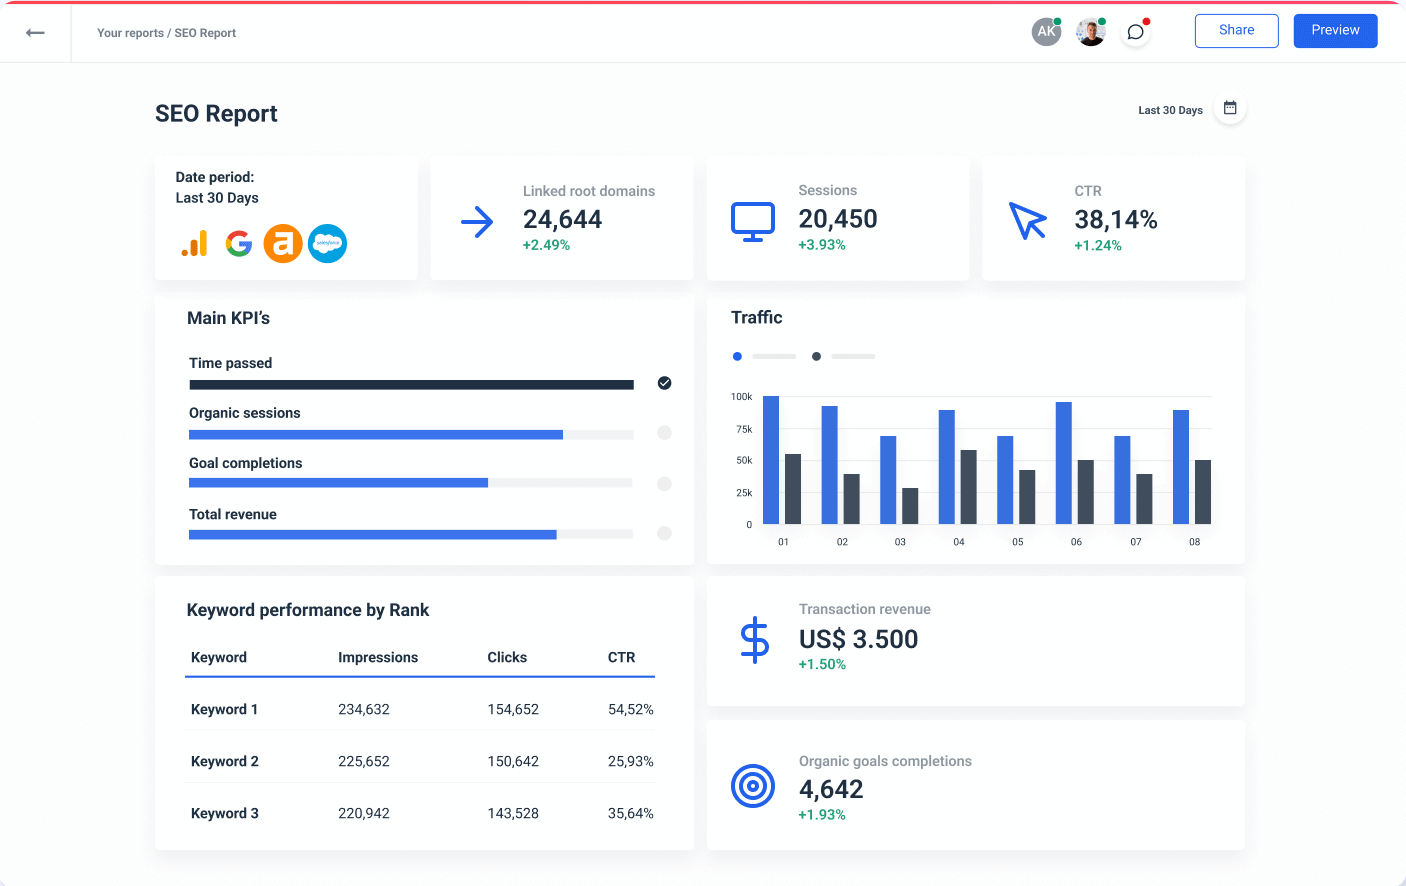
Need to create SEO reports for clients?
To save you time, our Product team created this SEO reporting template so you don’t have to start from scratch.
Looking for specific channel reports? Here are a few more options:
Connecting SEO metrics from different tools will give you a big picture of your organic performance. However, updating this information from report to report can be painstaking.
That’s where our White Label SEO Dashboard comes in.
- Connect your SEO tools and platforms,
- Choose the template from our library,
- The tool populates the interactive graphs, charts, and tables with your latest SEO data,
- Replace Whatagraph’s branding with your own.
10 Most Important Paid Media KPIs and Metrics
Paid media metrics measure the success and results of your paid campaigns, such as Google Ads, social media ads, and display advertising.
These are the 10 paid advertising metrics that top agencies monitor week-on-week.
Ad Impressions
This metric shows the total number of times your ad is displayed, with or without clicks. It measures the reach and visibility of your ad to the audience.
Why it’s important: High impressions improve brand visibility, so there’s more chance someone will click on your ad.
Cost Per Click (CPC)
This is a basic PPC metric that shows how much you pay for each click on your ad. It measures the cost efficiency of your paid campaigns.
Why it’s important: It helps you allocate your ad budget. If the CPC is low, you can increase your ad spend.

Click-Through Rate (CTR)
CTR is the percentage of people who clicked on your ad after seeing it.
“This tells you how often people click on your ads. It’s a good indicator of whether your ad designs and messages are catching people’s attention,”
Why it’s important: A high CTR shows that your ad is interesting to the audience, while a low CTR means you should give the copy and design a second look.

Cost per Acquisition (CPA)
Also known as Cost per Conversion, this metric shows the total cost of a customer who completes a specific action. It measures how much it costs to get one customer down your sales funnel.
In their agency, Castro tracks both Blended and New CPA:
“Blended CPA shows the average cost to get a customer, giving you a big-picture view of your spending. New CPA tells you how much it costs to bring in new customers, which is key for growth.”
Brandon Rollins from Pangea Marketing adds:
“For PPC, the main guiding light is cost per conversion. We'll watch click-through rate (CTR) and cost per impression (CPM), but only care about them if we see an opportunity to improve cost per conversion by improving one of those metrics.”

Customer Acquisition Cost (CAC)
CAC and CPA are very similar and useful metrics, but there is one key difference — CAC measures the cost to get a paying customer, while CPA measures the cost to get a lead.
Why it’s important: By analyzing CAC in more depth, you can calculate the overall value of a customer to your business.

Customer LTV (Lifetime Value)
“This is the total amount of money you can expect from a customer over time. Knowing this helps you plan long-term and see the value of each customer,”
– advises Erika Castro.
Why it’s important: Measuring LTV can help you be more strategic around pricing, advertising, and user retention.

LTV/CAC Ratio
Castro adds:
“This is one of the most important metrics out there for me. This compares how much a customer is worth to how much it costs to acquire them.”
Why it’s important: LTV/CAC ratio is most important for early-stage SaaS companies, as the KPI gives insights into the cost efficiency of their sales and marketing spending, which shows the sustainability of their business models.
“A higher ratio means your marketing efforts are sustainable and profitable. On average, brands usually set this at 3 or more. Anything lower, then you either have to improve your retention or drive your CPA lower”
– concludes Castro.

Conversion Rate
The conversion rate for PPC is the percentage of users who make a purchase or sign up after clicking on your ad.
Why it’s important: Conversion rate directly relates to your paid ads ROI and shows how successful your campaign is.

Return on Ad Spend (ROAS)
This metric shows the revenue from every dollar spent on advertising. It measures how profitable your ad campaign is.
Why it’s important: Although the conversion rate shows overall success, ROAS is a key metric for understanding the effectiveness of your advertising.

Quality Score
This is a Google Ads metric that measures the relevance of your ads, keywords, and landing pages. It is a number on a 1-10 scale that Google calculates based on ad relevance, CTR, and landing page experience.
Why it’s important: A higher Quality Score often leads to lower CPCs and better ad placements.
But the list doesn't stop here for Castro:
Frequency is one of those metrics that I look into whenever I need to determine if an ad is suffering from ad fatigue which what happens when your audience gets tired of seeing the same ad repeatedly, leading to lower engagement and effectiveness.
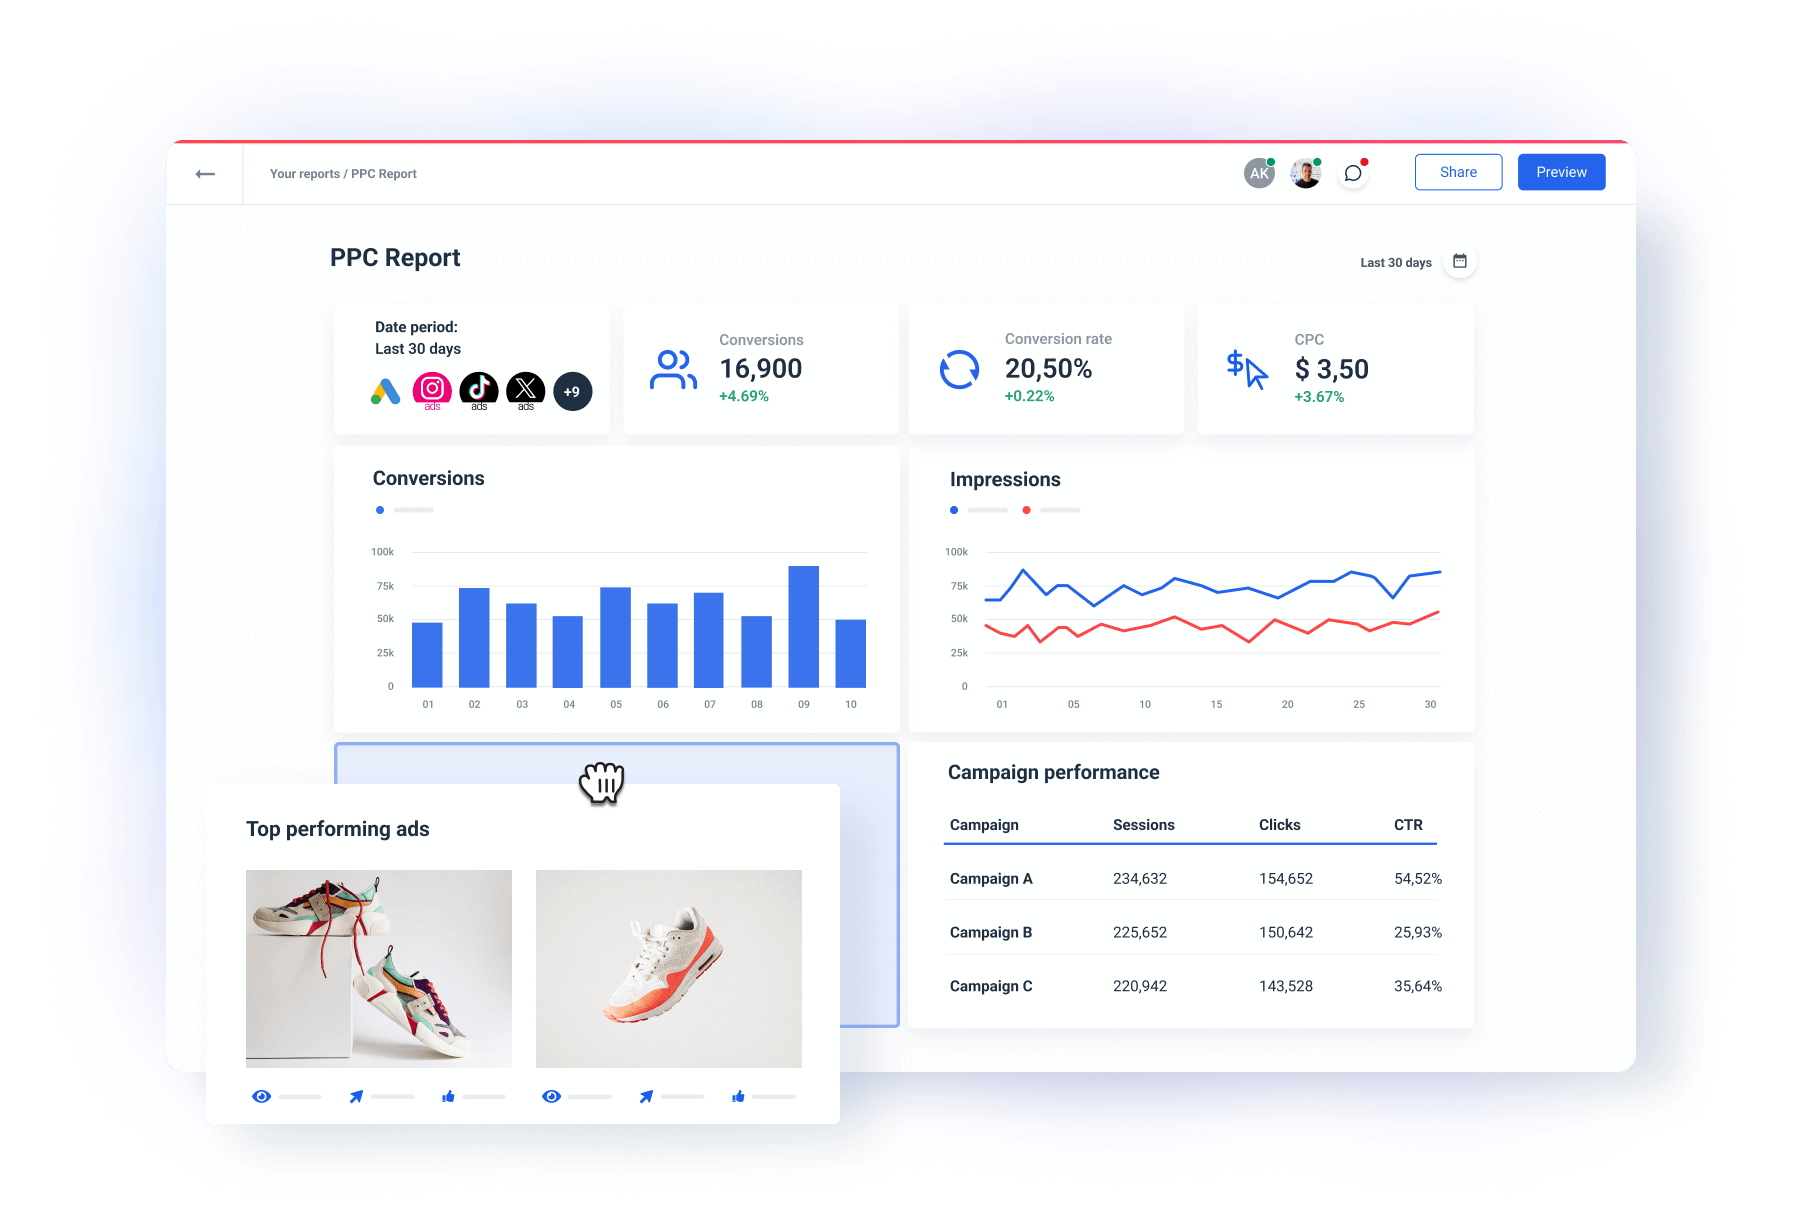
Need to create paid media reports at a scale?
Our Product team created thisr PPC Report Template, so you can save time for more creative tasks.
Need more options? Here are some templates for specific channels:
6 Most Important Social Media KPIs and Metrics
Social media KPIs track the performance of content and engagement across platforms like Facebook, Instagram, and LinkedIn.
Here are the top social media metrics and KPIs to track, as recommended by agencies.
Reach
This social media metric shows the total number of unique users who see your post. It measures how well your content is being shared.
Why it’s important: A larger reach is a sign of a higher brand awareness. Low reach, on the other hand, signals that there might be a problem with the content type or optimization.
Engagement Rate
Engagement rate is the percentage of people who like, comment, and share your social media posts. Similarly to CTR in paid ads, this metric shows how interesting your content is for your audience.
Why it’s important: Higher engagement rates show that your followers find your content valuable.

Follower Growth Rate
This metric shows the rate at which your audience on social media grows. It is a measure of your brand visibility and content reach.
Why it’s important: A steady growth rate suggests your content strategy is effective and your brand relevant for the target audience.

Social Share of Voice (SSoV)
SSoV is the percentage of online mentions your brand gets compared to competitors. It measures the visibility and presence of your brand on social media.
Why it’s important: This metric shows your brand positioning in the market.

Social Referral Traffic
This metric measures the amount of traffic your website gets from social media platforms. It shows how effective your social media channels are in driving website visits.
Why it’s important: It shows how effectively your social media generates leads.
You can track Social Referral Traffic using Google Analytics under "Acquisition" > "Social".
Video Views
The number of times the audience watches your video measures the popularity and engagement of your video content.
Why it’s important: High view counts indicate that your video is relevant to your audience. Average Video Views can tell you if your video strategy needs to change.
Video-based social media platforms like Snapchat and TikTok offer even more accurate metrics such as Video Views 25, 50, and 75% that show you how engaging a specific video is for the audience.
— — —
An agency that serves tens of clients can spend days creating reports with all the important social media metrics.
A professionally made social media report template can help you reclaim much of that time with:
- Performance breakdown by channel
- Follower demographic charts
- Auto-loading media widget that shows the top-performing post
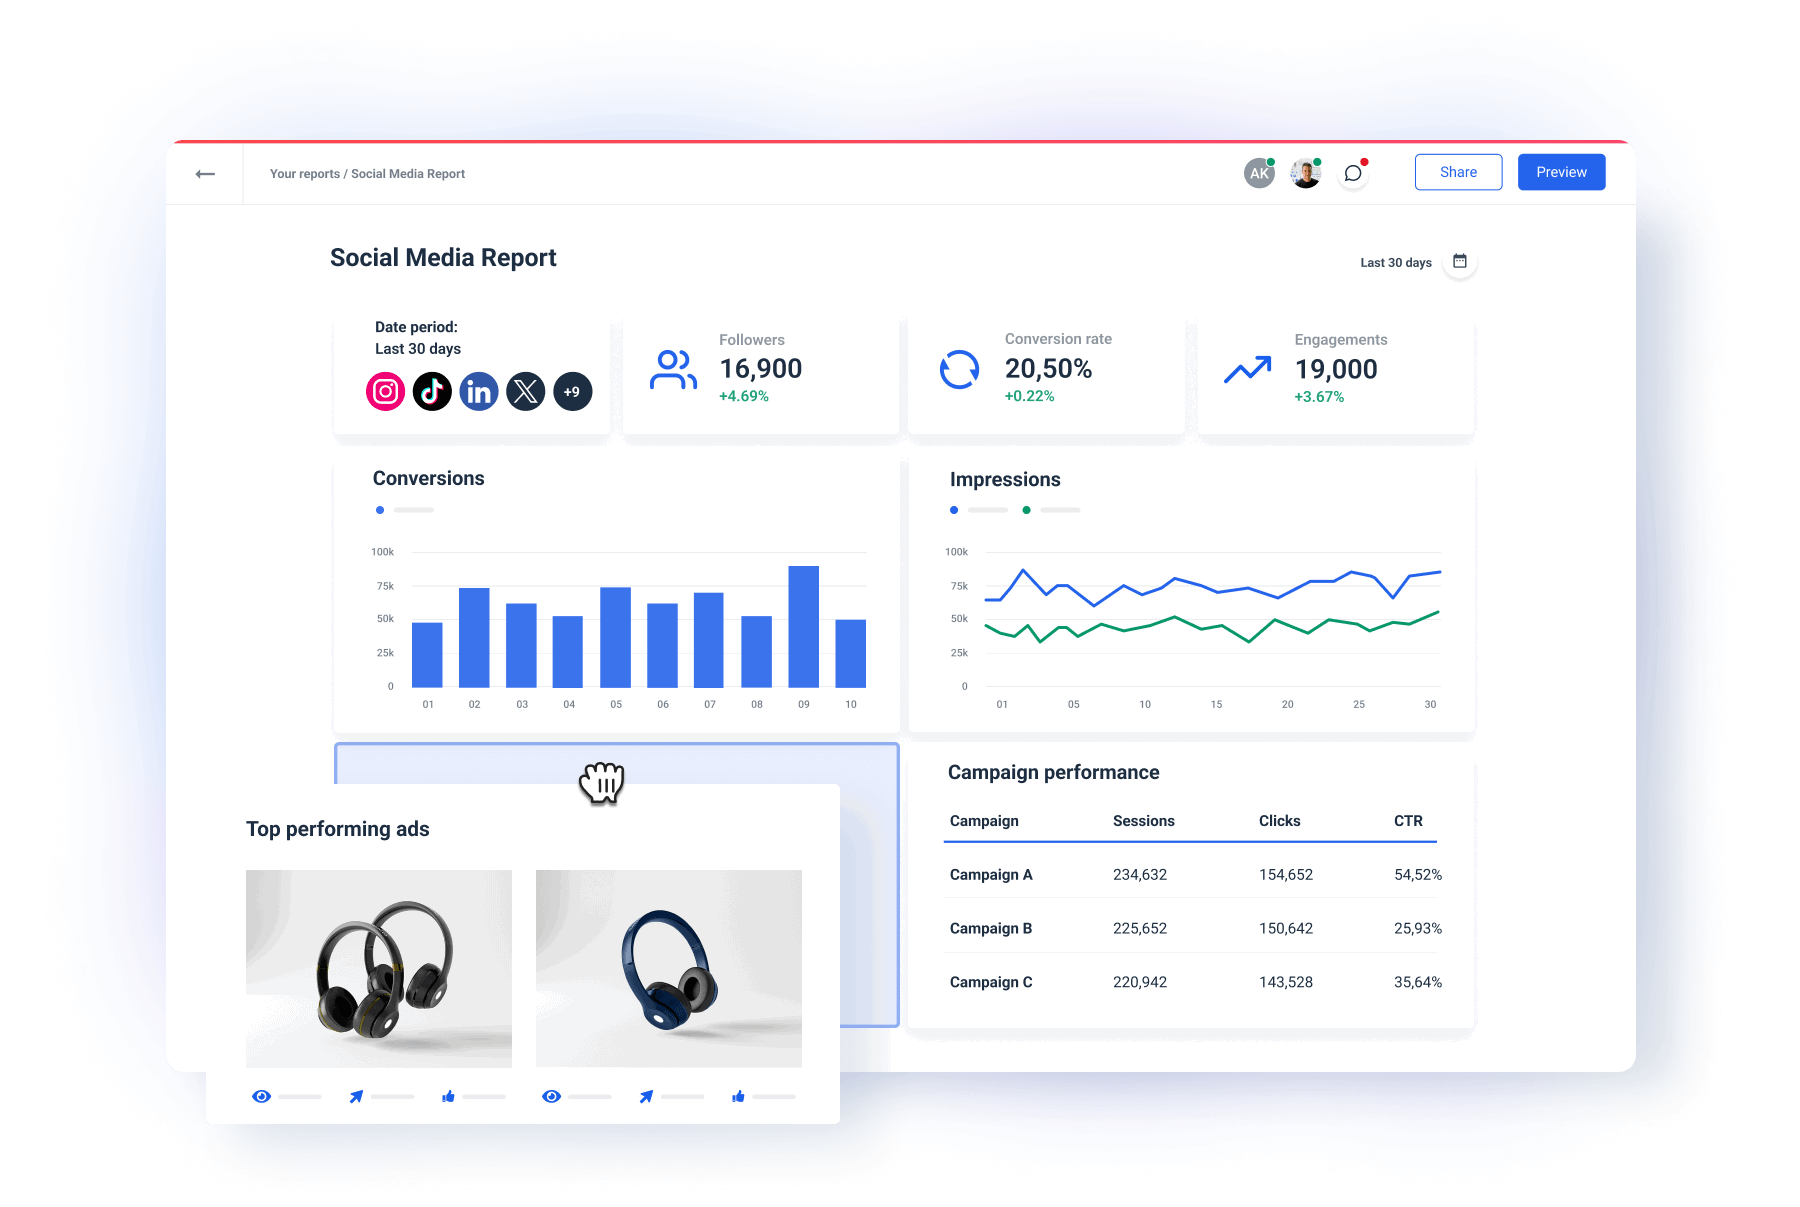
Need specific channel reports? Here are a few more options:
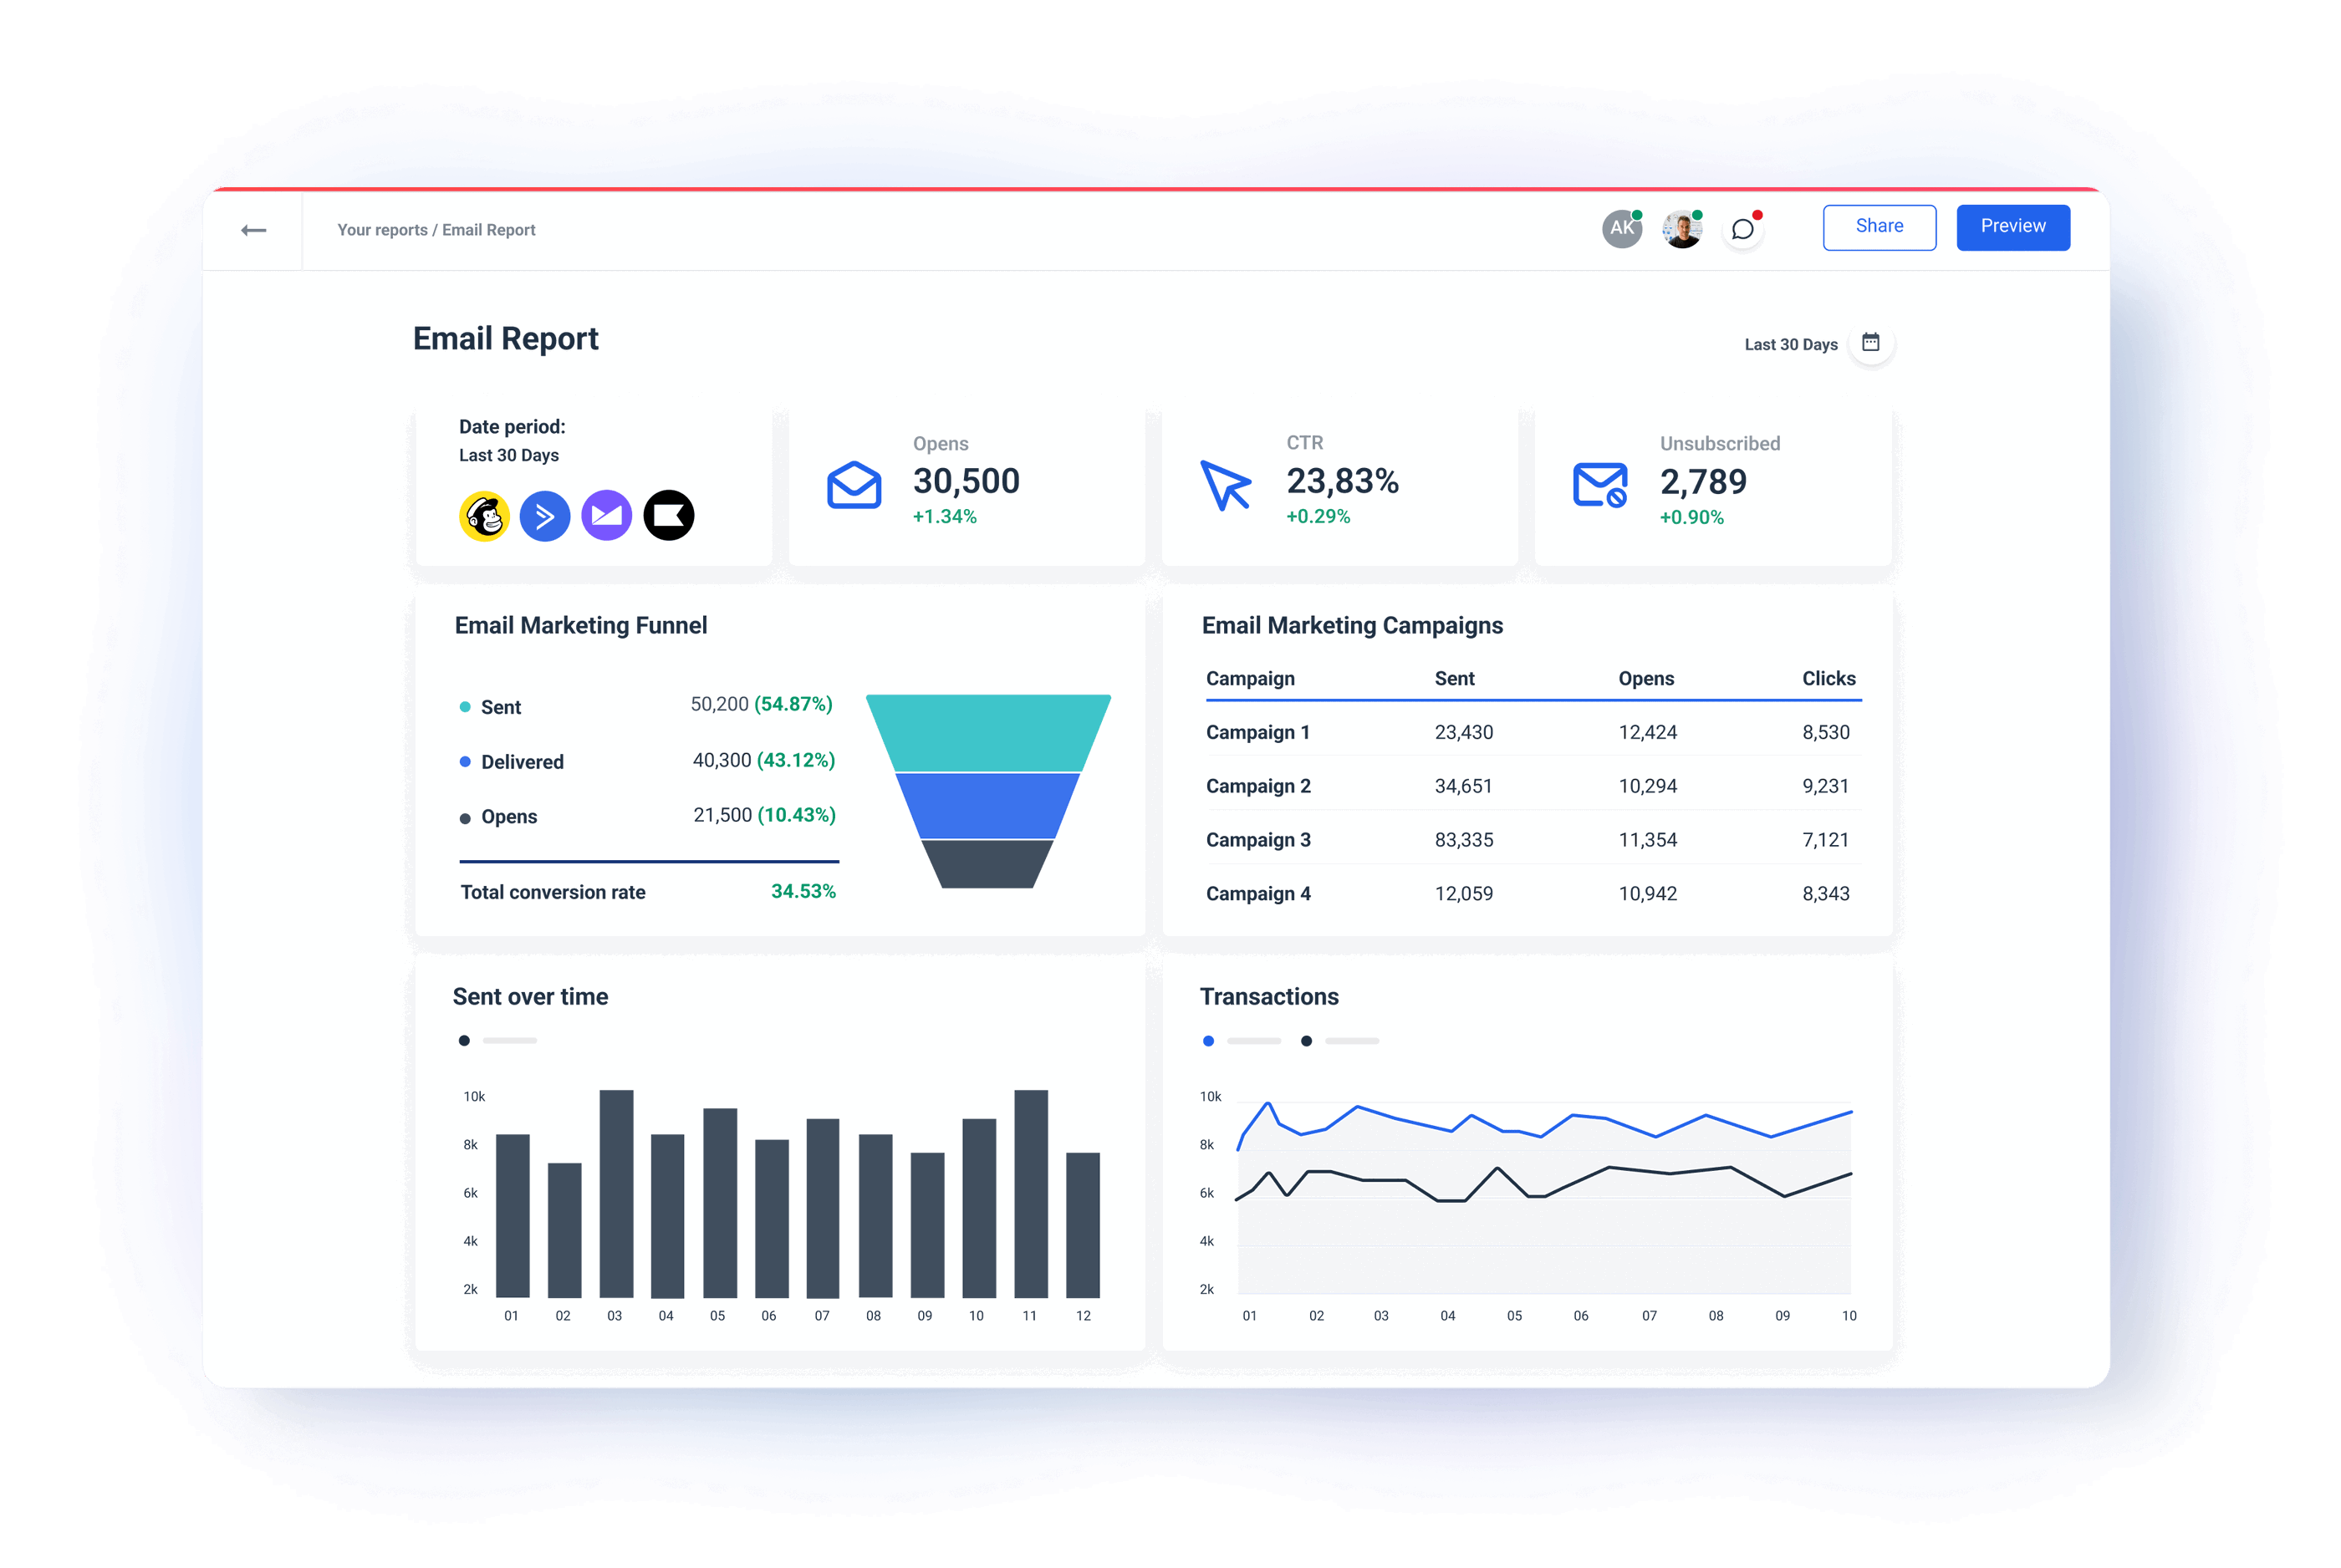
7 Most Important Email Marketing KPIs and Metrics
Email marketing metrics help measure the effectiveness of email campaigns in driving conversions, engagement, and sales.
Marketing agencies recommend tracking these digital marketing metrics and KPIs for email campaigns.
Open Rate
The open rate is the percentage of recipients who open your mail. It shows how effective your subject lines are in sparking audience interest. It also shows how well people recognize you as a relevant sender.
Why it’s important: A high open rate indicates that your email captured attention.

Click-Through Rate (CTR)
Email CTR shows the percentage of recipients who clicked on links in your email. It measures the relevance of email content and call-to-action.
Why it’s important: This metric shows how well your email engages readers to take a desired action.

Conversion Rate
Conversion Rate in email marketing is the percentage of recipients who completed a desired action, such as signup, or purchase after clicking a link in the email body. It shows how successful your email campaign is in driving conversions.
Why it’s important: This metric is directly linked to revenue generation from email.

Bounce Rate
This metric shows the percentage of emails that couldn’t be delivered. It measures the quality of your email list.
Why it’s important: A high bounce rate can harm email deliverability and your reputation as a sender. It is a sign that you need to clean and validate your email list.
One of the best practices is to only include people who ticked the “I want to receive emails” checkbox on signup.

Unsubscribe Rate
The percentage of people who decide to unsubscribe from future emails is called the unsubscribe rate. Just like the engagement rate, this metric measures how relevant your emails are for the audience.
Why it’s important: A low unsubscribe rate signals that you are delivering interesting and relevant content to your subscribers. By analyzing it more closely, you can improve audience segmentation.

List Growth Rate
This metric shows the rate at which your email list grows over time. It measures your success in attracting new subscribers.
Why it’s important: A growing subscriber list is a sign that your brand expands.

Email ROI
ROI in email marketing is the revenue generated from email campaigns in relation to their cost. It measures the profitability of your email marketing efforts.
Why it’s important: A higher ROI shows that you are spending your email budget efficiently.

For email marketing, we'll watch for open and click rates primarily, but we also keep an eye on spam reports and unsubscribes just in case we need to change course.
By the way, we have a killer email dashboard template that can save you a ton of time tracking and reporting email metrics.
5 Most Important Content Marketing KPIs and Metrics
Content marketing metrics measure how effectively blogs, articles, videos, and other content types attract and engage the audience.
“For content marketing and SEO, we'll monitor organic search traffic on the website in Google Analytics and popular keywords/queries in Google Search Console. This helps us know how much traffic we're getting from search engines, Google, in particular, as well as what people are looking for.”
– advises Rollins.
Here are some more content marketing metrics and KPIs to keep in your view.
Page Views
Page Views is the total number of times a page is viewed. It measures the popularity and reach of your content.
Why it’s important: High pageviews is a sign that your content attracts a lot of traffic. Low Page Views, on the other hand, may point to a problem such as slow loading speed, errors in redirects, Google penalties, or low-quality backlinks.
Time on Page
This metric measures the average time visitors spend on a particular page. Time on Page shows how engaging and readable your content is.
Why it’s important: Longer time on the page means visitors find the content useful or interesting. If your Time on Page is low, you may have to add more content, improve the design, or fix technical issues.
Rollins ads:
“We also like to pay attention to time on site to make sure people are meaningfully engaging with the pages they access. We also aim for good scores on SEMRush, GTMetrix, and PageSpeed Insights to prevent technical SEO issues too.”
Bounce Rate
Content bounce rate is the percentage of visitors who leave a page without taking any action. It measures how relevant and engaging your content is for people who see it.
Why it’s important: A high bounce rate may signal poor user experience, outdated content, clickbait titles, or a few more reasons. Here’s a complete list of possible problems.

Scroll Depth
This metric is the percentage of a page that visitors scroll through. Similarly to Time on Page, it measures your content engagement and quality.
Why it’s important: Scroll Depth helps you understand how much content is being consumed.
If your scroll depth is under 75%, you should organize it to be more readable. Create digestible sections with bullet points, add visuals and multimedia, etc.
Conversion Rate
In content, the Conversion Rate is the percentage of users who complete a desired action on your content pages. It measures how effectively your content drives conversions.
Why it’s important: It’s one of the most accurate metrics of user experience and content quality. It shows how tailored the content is for the visitors.

— — —
Need help creating professional, organized reports for GA4?
Grab our Google Analytics 4 Report Template and present the most important content marketing metrics in a way your clients can easily understand.
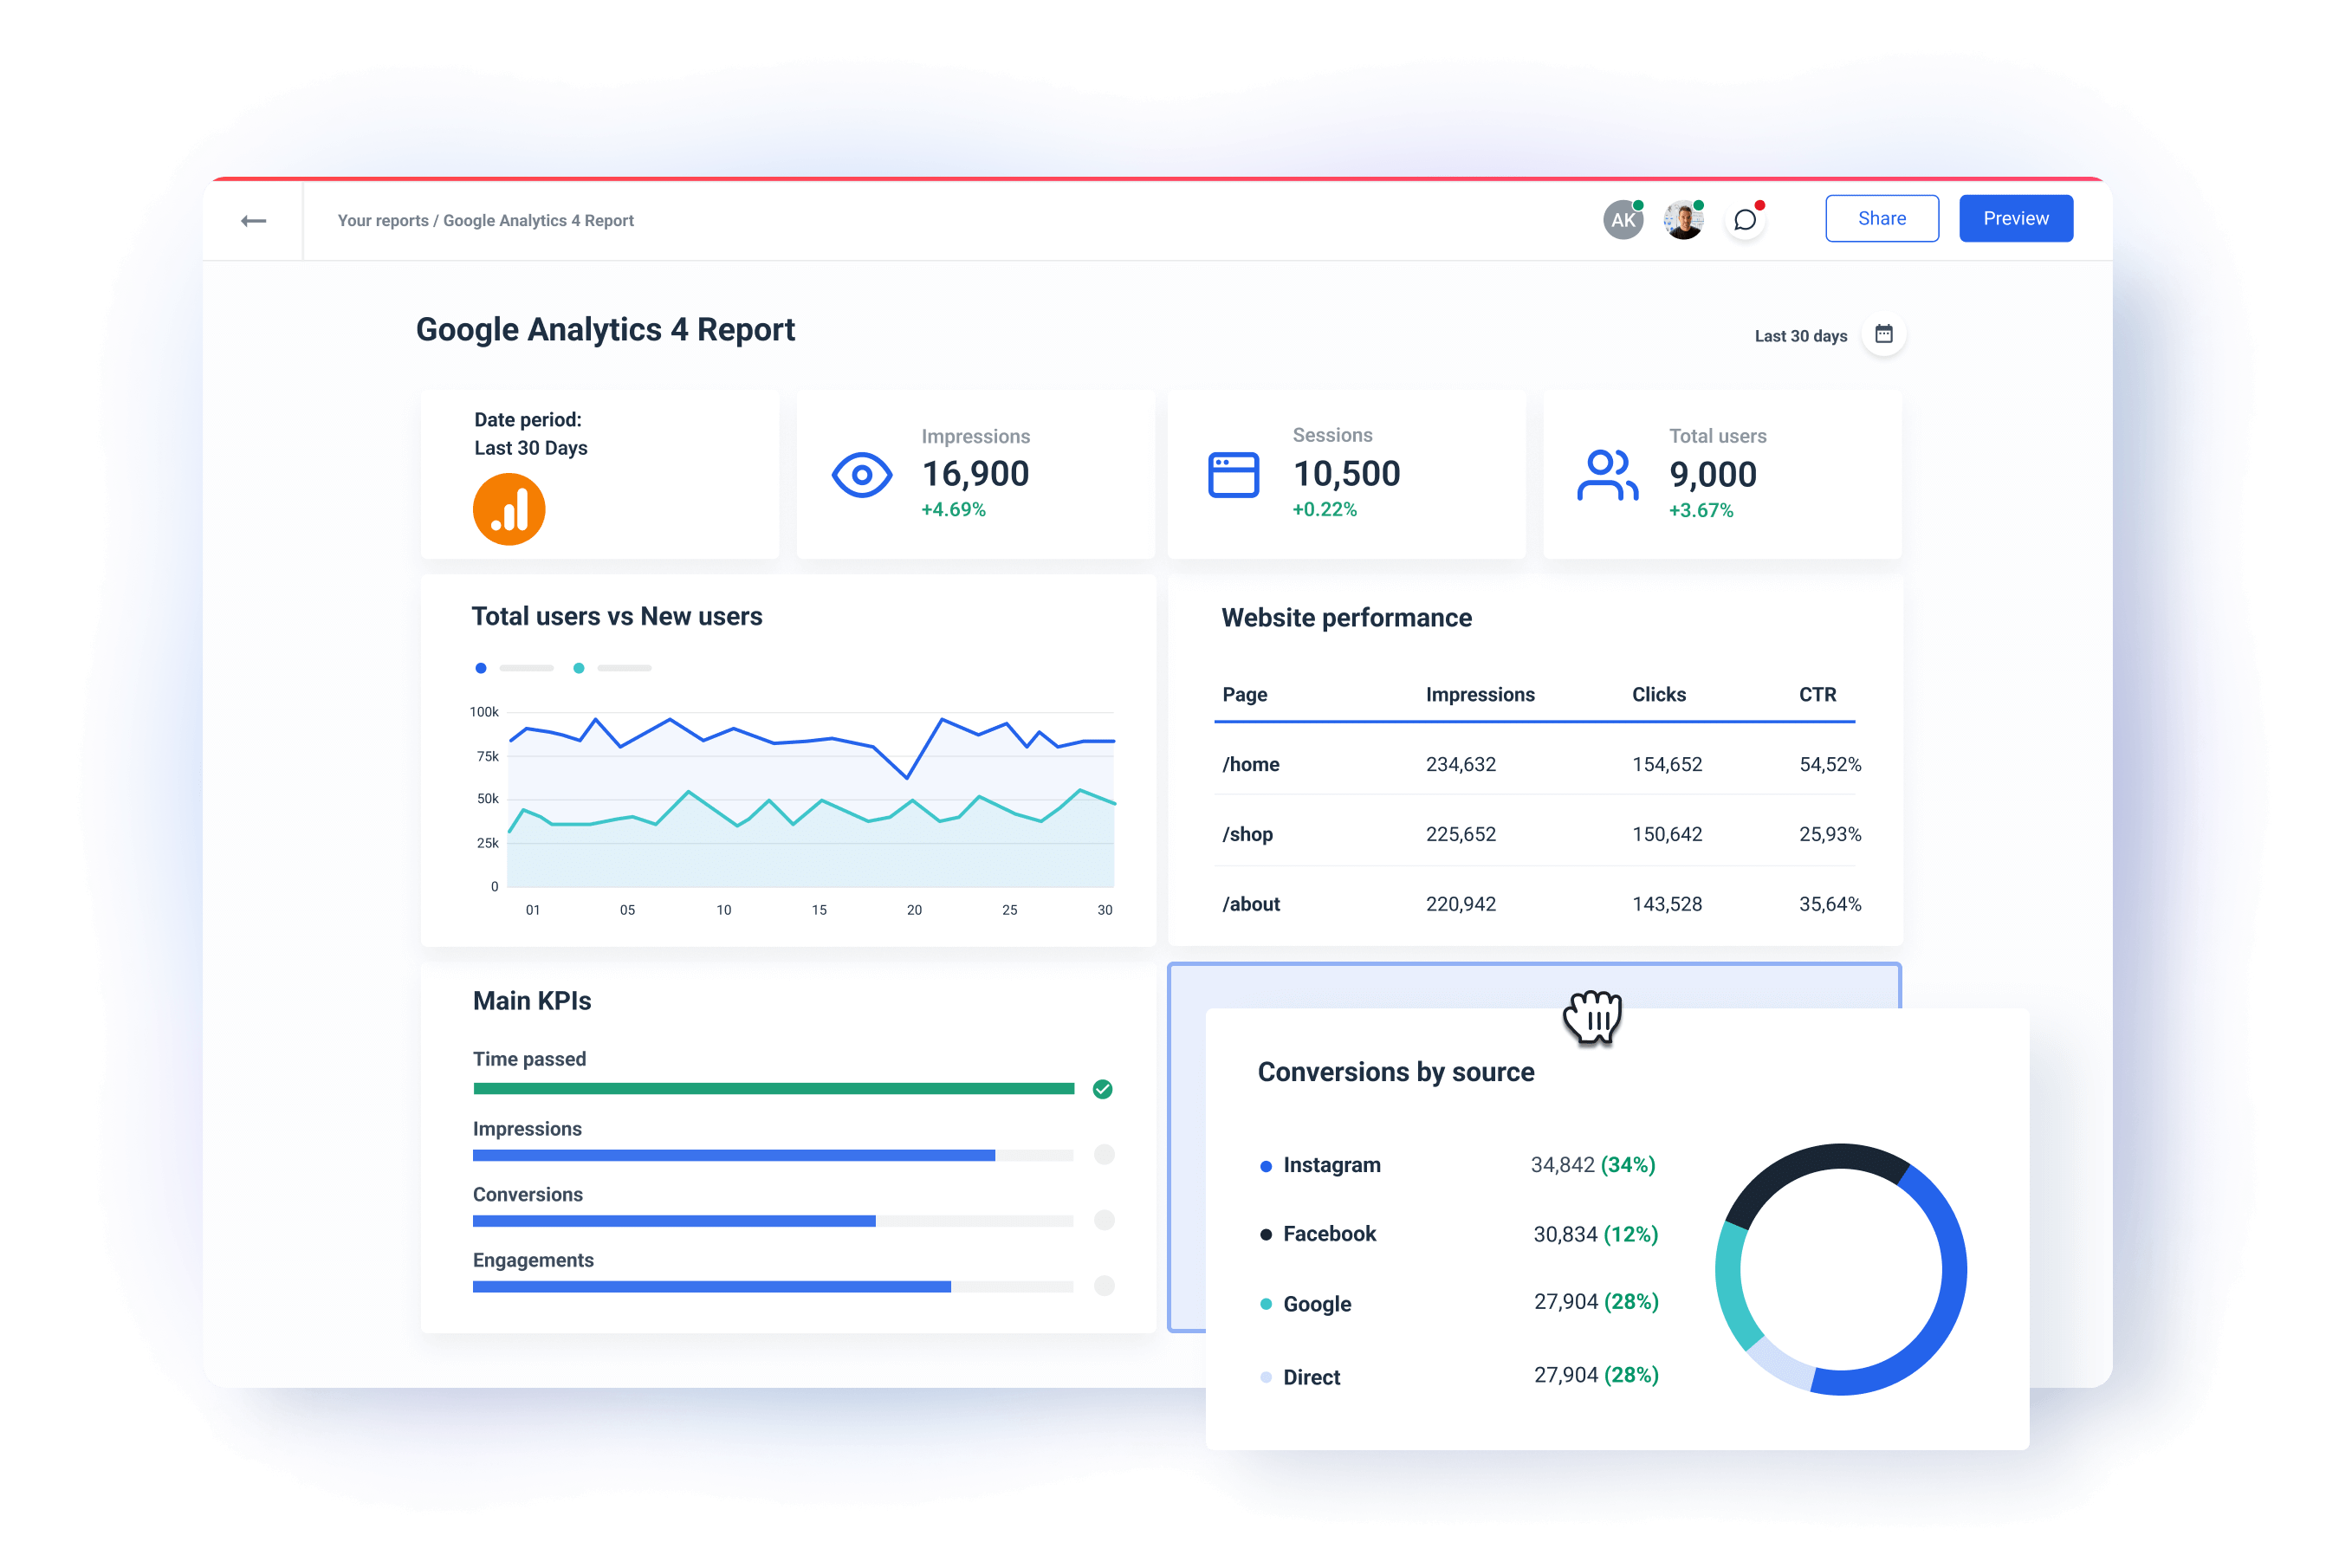
Offer in-report recommendations on how to optimize content for more conversions. Customize the report with your logo and brand colors.
How to Track and Report on Digital Marketing Metrics and KPIs?
Erika Castro explains:
“I break down performance by channel, starting with the highest spend (e.g., Meta, Google, Pinterest, etc.). For each channel, I explain the overall performance, highlight key insights, and discuss how different funnels are working together to drive results.”
This is a good approach, as clients can easily see the best-performing channel, while marketers can use the results to recommend what to improve on others.
So, how can you track and report channel performance metrics?
There is a hard way, a slow way, and the right way.
Let’s quickly run through the pros and cons of each.
Spreadsheets
Most spreadsheet tools like Microsoft Excel or Google Sheets are free or cost little, especially when you compare them to dedicated data platforms.
“For most clients, we keep a running a spreadsheet, updated weekly with all the metrics we care about. That Google Sheet is broken into sections, relevant to SEO, PPC, email marketing, as well as basic financial measures (revenue, profit margin, etc.) if we have them.”
Spreadsheets seem to have many advantages right off the bat:
✅ Flexible
✅ No training needed
✅ Easy sharing and collab
But, when you need to track and report on a large number of marketing sources, clients, and accounts, spreadsheets quickly show their limits.
❌ Time-consuming: Entering data manually, formatting, and updating formulas takes a lot of time, especially when you need to manage a lot of data and create many reports.
❌ Prone to errors: It’s painfully easy to make a mistake in data, formula, or calculation.
❌ Hard to scale: As you add more data, the spreadsheet becomes more difficult to manage. The document slows down or even starts crashing.
❌ Limited automation: Unless you use advanced automation scripts (e.g., Google Apps Script or VBA), you need to update spreadsheets manually.
❌ No real-time data: Spreadsheets don’t automatically pull data from marketing platforms like Google Analytics, Facebook Ads, or email service providers.
❌ Hard to analyze multi-channel data: There’s no native integration with marketing tools or platforms. Organizing data to analyze blended metrics or multi-channel attribution is very much manual, with a huge marking for error.
Rollins explains their process:
“We give client a link to the Google Sheet so they use it directly. But most prefer to have additional context, so we then either go over it with them on a call or we send summaries of the data they care about most by email”.
Looker Studio
Looker Studio is a free tool for visualizing and reporting marketing metrics. It’s especially useful for businesses that rely mostly on Google products.
✅ Free tool
✅ Integrates seamlessly with Google products
✅ Large number of connectors
On the other hand, Looker Studio has several serious drawbacks that make it less ideal for large marketing teams:
❌ Limited free connectors: You need to buy third-party data connectors to plug non-Google sources like Facebook, LinkedIn Ads, or HubSpot.
❌ Gets slow with more data: Looker Studio often slows down when handling large datasets, more sources, or several visualizations in one report.
❌ Delays in refresh rate: With some sources, you don’t have real-time data updates. Different third-party connectors have different refresh rates, so your report may be inaccurate.
❌ Limited data transformation: You run into more limitations when you try to blend data. Also, there’s no way to create a custom formula on a source level. You need to do it for every widget… in every report.
❌ Hard to customize: You will most likely need help from a data analyst or developer to customize your dashboard the exact way you want.
❌ No bulk report edits: If you need to change the same detail on 50 reports, you need to do it one by one.
❌ No widget templates: If you create a custom widget, there’s no way to save it for future reports. What happens in a report stays in the report.
Use Whatagraph
Whatagraph is hands down the easiest, fastest, and best-looking solution for tracking and reporting on digital marketing metrics and KPIs..
Developed with the pain points of large marketing teams in mind, Whatagraph matches the ease of use with advanced data tracking and reporting options.
So why should you consider Whatagraph over spreadsheets and Looker Studio?
By automating our data collection and reporting, we have not only made our own operations more efficient, but above all improved our customers' access to information. They can now benefit in real time from deeper insights presented in a clear and user-friendly way. We can now together make faster and even better decisions!
✅ Connect all sources in a few clicks: Add as many sources you want to any report you create.
✅ Data updates automatically: There’s nothing to refresh, reload, or update on your side. Data is refreshing automatically from every source.
✅ Highlight the metrics you want: Create a high-level summary at the top of every report for C-suite executives with the most important metrics and KPIs.
✅ Edit multiple reports at once: Even if you need to update 100s of reports, edit the master report and the changes sync with the rest.
✅ Easy to use overall: Build any kind of report with ease. Dedicated CSM and live chat is included in all plans.
Book a demo of Whatagraph today, and let us know how we can help you track and report digital marketing KPIs and metrics.
Published on Aug 03 2022
WRITTEN BY
Nikola GemesNikola is a content marketer at Whatagraph with extensive writing experience in SaaS and tech niches. With a background in content management apps and composable architectures, it's his job to educate readers about the latest developments in the world of marketing data, data warehousing, headless architectures, and federated content platforms.